Week 12: Euphoria, panic, and despair
Almost time to go dumpster diving for "Disruptive Innovators™"
Hi.
Welcome to Fifty Trades in Fifty Weeks!
This is Trade 12: Euphoria, panic, and despair
Thank you for signing up!
50in50 uses the case study method to go through one real-time trade in detail, about once per week. This Substack is targeted at traders with 0 to 5 years of experience, but I hope that pros will find it valuable too. For a full description of what this is (and who I am), see here.
Listen to this as a podcast on the web
… or Spotify
… or Apple.
Update on previous trades
ASHR and SPX trade are both stopped out as China, Europe, NFLX, and the breakdown in copper trigger concerns about global growth.
Pattern recognition
Pattern recognition can be useful in trading, as “I've seen this movie before!”, can often be the feeling right before “I know what's going to happen next!”. That said, it's also important to remember that human beings are biased to see patterns, even where none exist.
Today, I look at one of the most well-known patterns in markets, the euphoria/panic cycle that defines speculative bubbles.
Speculative bubbles follow two primary patterns.
Inflate / collapse / prosper, or
Inflate / collapse / die.
.
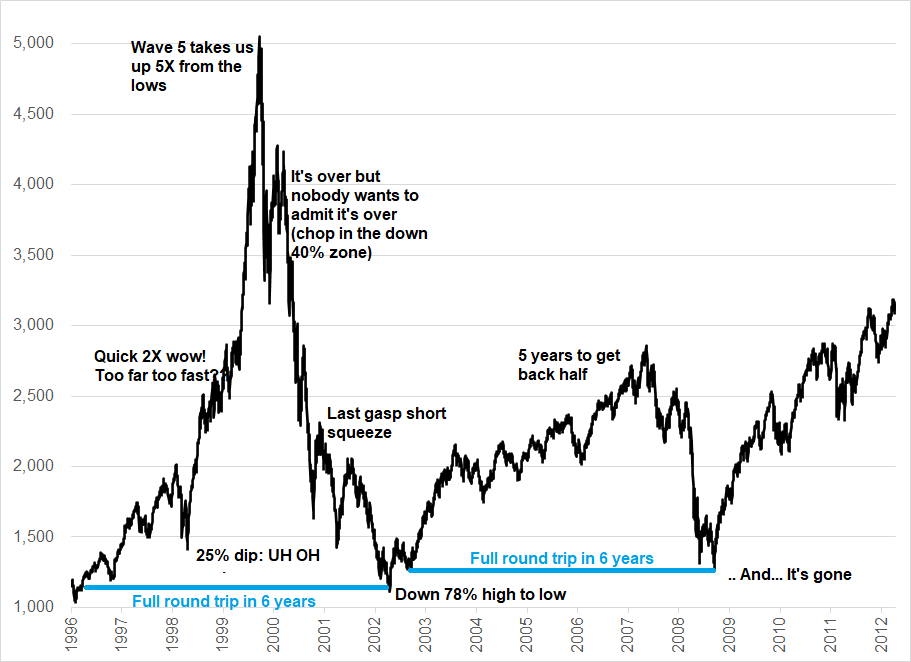
Let’s start with two examples where the bubble laid the seeds for a subsequent, epic bull market. Here is the NASDAQ bubble, which laid the groundwork for the massive tech bull market of the 2010s.
NASDAQ: 1996 to 2012
And here is the bitcoin bubble in 2017, which was the seed for massive crypto prosperity in the 2020s:
Bitcoin: 2017 to late 2020
The bitcoin and NASDAQ bubbles are virtually identical if you account for the fact that bitcoin is much higher vol than NASDAQ.
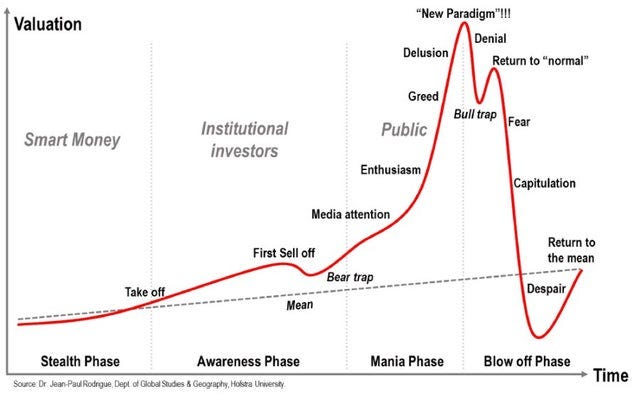
Not all movies have happy endings, though! Other bubbles, like gold in 1980, and the Nikkei in 1990, were dead money for decades. You may have noticed that the pattern on those two charts is similar to the textbook speculative bubble asset pattern:
It is truly uncanny how every bubble looks pretty much the same. And here’s a chart of the ARKK bubble so far:
ARKK ETF, April 2019 to now + a bit more
The two most likely paths for a bubble asset after it bursts are:
Complete the round trip, stabilize, and rally. This is what happened with the NASDAQ in 1999, US housing in 2006, and 2017 bitcoin bubbles (for example).
Fizzle and grind towards zero or go nowhere for literally decades. This is what happened with the 1980 gold bubble, the 1990 Nikkei bubble, CMGI in 1999. And the tulips.
.
The heavily-marketed Disruptive Innovators™ narrative, the deification of Cathie Wood, and the run-up and collapse in the ARKK ETF all rhyme perfectly with 1999. The whole thing looked, smelled, and felt EXACTLY the same. This is not hindsight, many commentators (including me) wrote about it in 2021.
Using 1999 as the comparison, ARKK is likely to follow one of two analogs.
Janus (complete the round trip, stabilize, and rally).
CMGI (fizzle towards zero or go nowhere for literally decades)
.
Let’s start with Janus.
Janus was the high-flying fund manager most associated with the 1999 dotcom bubble. They were heavily concentrated in the stocks that went to the moon. They rode the wave all the way up and all the way back down. So did their investors. This headline is peak Janus.
February 9, 2000
And a few years later…
January 12, 2003
As I said, ARK’s concentration and the manic herding of bullish retail in 2021 was nothing new. It was recognized well before ARKK peaked, for example in this January 2021 article. The article was prescient; ARKK peaked about a month later.
January 7, 2021
Here is an excerpt:
“Cathie Wood of ARK is not the first highly concentrated active manager to shoot the lights out for half a decade while sparking a stampede of flows into their funds. There have been many throughout history but perhaps the one that most echoes ARK today is the famous Janus Twenty Fund, which dominated the latter half of the '90s and early 2000s with very similar returns and flows to what ARK is experiencing, albeit one met with a 50% downturn when the Internet bubble burst.”
The next chart shows the path followed by Janus 20. The fund was mostly invested in megatech, so it rebounded with the indexes. Those that bought in the 30s, after the full round trip 30-90-30, did very well.
Janus 20 Fund, 1989 to 2015
A less flattering comparison for ARKK would be CMGI.
CMGI was also one of the most famous internet names of the late 1990s. You could describe it as a hybrid of ARKK and SoftBank. It was a holding company and active investor running a concentrated portfolio of internet favorites. This is from a 1999 press release:
About CMGI
With nearly 50 companies, CMGI, Inc. (Nasdaq:CMGI) represents the largest, most diverse network of Internet companies in the world. This network includes both CMGI operating companies and a growing number of synergistic investments. CMGI leverages the technologies, content, and market reach of its extended family of companies to foster rapid growth and industry leadership across its network, and the larger Internet Economy.
CMGI's majority-owned subsidiaries include Engage Technologies (Nasdaq:ENGA), Activerse, Adsmart, AltaVista, Cha! Technologies, iCAST, Magnitude Network, NaviSite, NaviNet, Planet Direct and ZineZone. The company's @Ventures affiliates have ownership interests in Lycos, Inc. (Nasdaq:LCOS), Critical Path (Nasdaq:CPTH), Silknet (Nasdaq:SILK), Chemdex (Nasdaq:CMDX), Ancestry.com, Asimba, AuctionWatch, Aureate Media, blaxxun, BizBuyer.com, buyingedge.com, CarParts.com, CraftShop.com, eCircles.com, EXP.com, FindLaw, Furniture.com, HotLinks, Intelligent/Digital, KOZ.com, Mondera.com, MotherNature.com, NextMonet.com, NextPlanetOver.com, OneCore.com, ONElist, PlanetOutdoors.com, Productopia, Promedix.com, Raging Bull, Softway Systems, Speech Machines, ThingWorld.com, Vicinity, Virtual Ink, Visto and WebCT.
Here’s how CMGI stock has fared (there were a few restructurings and renamings along the way):
CMGI stock, 1985 to now
CMGI was invested in a pile of high-burn-rate up-and-comers and the bets didn’t pay off as most of the names in the portfolio went bust. CMGI’s holdings were competed out of business or the companies burned through all their cash and what looked like infinite funding in 1999 dried up by 2001. If I go through that list of CMGI companies, I can’t think of one that is still alive.
Does ARKK remind you more of CMGI (a list of random high-burn-rate companies) or Janus 20 (a list of megacaps)? It’s more like CMGI than Janus 20, but you could argue it’s somewhere in between. Here are the top 10 holdings in ARK:
Tesla, Zoom, Teladoc, Roku, Coinbase, Square, Exact Sciences, Unity Technologies, Spotify, Twilio, CRISPR and UiPath.
After Tesla, the average market cap is $24B. Not tiny but not mega.
If you think ARKK rebounds, the buy zone is the full round trip: The $40/$50 zone that defined the stock’s equilibrium through the pre-COVID 2019 period. If you think ARKK is CMGI, don’t touch it. If you think it’s somewhere in between, there’s a middle way.
Trade 12: Buy ARKK at 49, 45, and 43 with a stop loss at 29
I like the middle way. Attempt to participate in the upside, but control the downside.
Go long at 49 / 45 / 43 (scaling in as the ARKK ETF goes back to where it started pre-COVID—that is: round trip complete!) with a stop loss at 29 (below the 2020 COVID lows). This gives you the upside if the round trip completes and Cathie Wood rises from the ashes like Janus. But it allows you to manage the risk if TSLA is massively overvalued and the rest of the basket turns out to be full of cow dung, not chocolates.
Buy and hold is way too risky with a potential value trap like this but the opportunity to buy the epic dip that rhymes perfectly with 1999 is too attractive to ignore. You want to own the upside, but use a stop loss to control the downside. The completed trader framework is here.
Fun math fact
Another reason to take a shot at a long in ARKK (at the right level) is that burst bubbles tend to see incredibly large countertrend bounces, even if they eventually go to zero. Here’s the pattern of a stock that goes down 50% then up 50% over and over:
A stock that drops 50% and rallies 50% over and over
Conclusion
Pattern recognition can be a useful tool when analyzing markets. The euphoria, panic, and despair cycle traced out by speculative bubbles is common and well-known.
Establishing where you are in a clear pattern or cycle can give you a useful starting point for analyzing the market and forecasting future moves. In this case, we are near the full round trip point for ARKK.
And that means it’s almost time to start dumpster diving.
That's it for today. Thanks for reading. If you liked this episode, please do me a favor and click the LIKE button. Thanks!
Trade at your own risk. Be smart. Have fun. Call your mom.
My global macro daily is here
My crypto substack is here
And this is my Twitter
DISCLAIMER: Nothing in “50 Trades in 50 Weeks” is investment advice. Do your own research and consult your personal financial advisor. I’m putting out free thoughts for people who want to learn. This is an educational Substack. Trade your own view!


Q) ARKK:JANUS20::?:CMGI
A) Softbank
Really enjoy the content, thanks Brent.