Hi. Welcome back to Fifty Trades in Fifty Weeks!
This is Week 27: Time of Day
50in50 uses the case study method to go through one real-time trade in detail, about once per week. This Substack is targeted at traders with 0 to 5 years of experience, but I hope that pros will find it valuable too. For a full description of what this is (and who I am), see here.
If you want to learn about global macro in real-time … subscribe to my daily: am/FX
Listen to this as a podcast on the web … or Spotify … or Apple.
Quick update on previous trades
The short SPY trade is back from the dead and now in the money, as we peaked right into mega resistance at the trendline and 200-day MA at 4300/4330 in SPX. As someone who uses technical analysis but is also kind of skeptical of techs at times, I must say combining sentiment and techs with a macro bearish view of tightening liquidity has been an excellent framework all year. Every bounce in EURUSD stops exactly where it should. The S&P 500 rallies stop exactly where they should.
The MSTR short from Week 25 hit the take profit and was an absolute thing of beauty. High leverage, zero pain. The post-split TSLA short broke even after a few jitters on the open.
Here are the results from last week’s sentiment vs. confidence survey. Similar to week one and two, people were looking for lower stocks and generally tighter financial conditions. The consensus has been generally correct. I will be interested to see if people are still so bearish now that everything has moved so much.
Sentiment vs. confidence (1 is least confident, 5 is most confident)
Here’s this week’s survey. Please take two minutes to fill it out! Thanks.
Now, let’s talk about time of day patterns and considerations.
Time of Day
Microstructure is the study of flows, liquidity, intraday activity patterns, price discovery, transaction costs, volatility, and anything else that is part of the underlying structure of how, when, and why markets move. Chapter 8 of Alpha Trader is all about microstructure. It’s an important topic and the place where short-term traders can most easily find an edge.
There is not one easy answer to: How do you find an edge using microstructure? It depends on the market you trade, your time horizon, your trading style, your amount of capital, and your transaction costs. But even those trading longer time frames can use microstructure analysis to optimize entry and exit points, determine stop losses, and avoid common traps and leaks.
In this week’s 50in50, I explain one particular facet of microstructure: Time of day. I put together four radically different examples of how time of day matters, and I hope that these examples will stimulate ideas for how to trade time of day in your market. When you’re done here, think about your market. What are the features, nuances, anomalies, patterns, and inefficiencies you see at various times of day?
Intro
Just about every market has various textures and features depending on the time of day. There are windows where flow dominates. There are high-volume, highly volatile periods, and there are times of the day that are random, drifty, and stupid. Much of this relates to flows going through the market because flows tend to center around particular times.
Just to give you a sense of how volume varies by time of day, here are two charts.
S&P 500 futures, average volume by time of day
EURUSD, average volume by time of day
Volume and volatility tend to be correlated, though that is not always the case. Here’s the volatility of AAPL and SPY, by time of day:
Average range of AAPL and SPY, by time of day
As a general rule, good traders are active when things are moving, and when volumes are high. High volatility is a predictor of high P&L for good traders (expected value but not every single day) and transaction costs are lower when markets are busy.
As such, the first thing you want to do, if you know nothing else, is focus on the busiest times of day for your market. There are traders that make a living only trading the open and close of stocks, for example, and many of those traders consider the rest of the day mostly noise.
Let’s look at three specific time-of-day strategies. The point is not for you to start trading these strategies yourself. The point is to show you some examples, and then let you find your own strategy in your own market.
Time of Day Example 1: The Gap and Trap in Stonks
I like to read academic papers about finance but generally find them boring and at times find them hard to understand. This paper is not boring; it’s well written and easy to understand:
Night Moves: Is the Overnight Drift the Grandmother of All Market Anomalies?
The fact that equities outperform overnight and suck wind intraday is well known and has been known for years. Here is a chart from the paper. Variations of this chart have been going around for more than two decades.
And here is NASDAQ performance by hour of day over the past twelve months. The big down bars at 9 and 10 show the 9 am to 11 am period is no bueno.
NASDAQ futures performance by hour of day (NY time)
While this effect is well known, a good explanation has been lacking. The authors of the paper do an excellent job of explaining some theories in plain English and the theory that makes the most sense, by far, is that retail traders tend to net buy stocks, and retail traders tend to leave “buy on open” orders.
This creates a premarket buy imbalance which means market makers must move the price as high as possible into the open (at which point they are now short the stock) and then step away once the opening bell rings and the imbalance is filled. This is similar to any fixing in the FX or oil markets.
There is a large imbalance centered on a particular moment in time and the market peaks right at that time. So… It’s not that stocks do well overnight and poorly during the day, it’s that individual stocks attract buy imbalances on the open and those imbalances drive individual stocks up into 9:30 am. In aggregate, this effect can be seen in the futures, but it operates at the single stock level.
The more retail-y the stock, the bigger the impact:
When I used to trade single-name equities at a place called SwiftTrade during the dotcom bubble, one of the main strategies I used was called the “gap and trap.”
Put simply, you look around for the biggest pre-market topside gappers, wait until about 10 seconds before the open, go short, and cover about ten minutes later. If there was big news overnight, it attracts retail “buy on open” orders and it also triggers resting stop losses that will all be filled at the opening price. Market makers are going to be short the net balance at 9:30 am and so their incentive is for that open to be as high as possible.
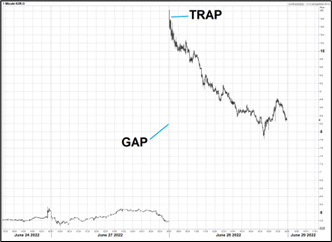
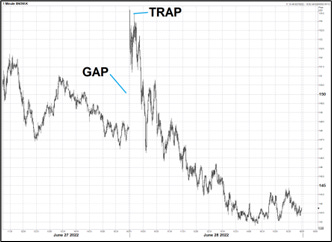
I wrote about this phenomenon in June, in am/FX, my global macro and trading daily. KZR and SNOW were two examples that popped up that day. Here is how they traded. KZR was a buyout story and SNOW was an investment bank upgrade.
KZR and SNOW: Gap and traps on 28JUN
The gap and trap is hard to risk manage because you are getting involved with extreme volatility and trading right into a frenzy. That’s why they are fun and profitable. But they also require strong discipline because they are the kind of trades that can keep ripping and wipe you out if you don’t know what you’re doing.
Time of Day 2: Closing Time in Oil
There are particular windows of time each day where flows are likely to be transacted. The best-known of these would be the open and close of US stocks (9:30 am and 4:00 pm Wall Street time) but there are many others.
Traders at banks and hedge funds have a distinct edge here as they know much more about flows than a trader sitting behind a screen at home. Still, there are simple ways to identify the time of day effects in your market.
Flow generally has both a signal and a noise component. Flow is often a real market participant (not a speculator) transacting in the market and that can have important directional information. For example, when a Japanese oil importer buys USDJPY, there is both a signal and a noise component.
Signal: Japan’s petroleum trade deficit is impacting the currency market in an observable way.
Noise: USDJPY just shot up 50 points and will mean revert whenever the buyer is done.
As a general rule, flow moves the market and when the flow is done, there is partial mean reversion of the move caused by the flow. This is not always true because a flow can create momentum that triggers more flow or stop losses and spec activity in the same direction.
The window for flows varies dramatically by the product you trade, but every market has windows of time where flows are most dominant. Think about strategies to predict the flow and trade ahead of it, trade the mean reversion after the flow, or simply avoid getting your head ripped off by random, unexpected volatility. A particularly nutty time of day effect is the NYMEX close at 2:30 pm NY time.
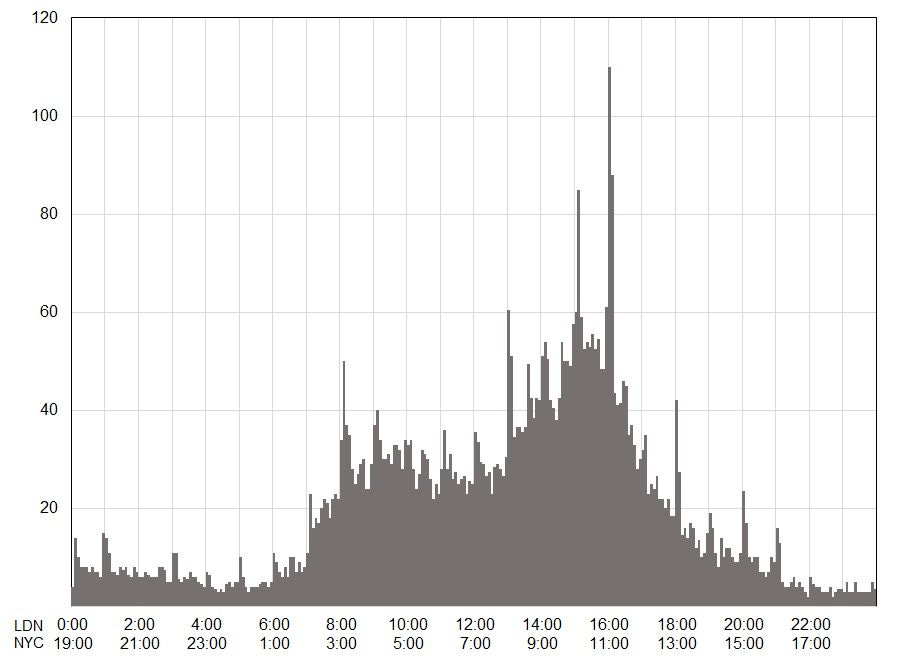
Here’s how average crude oil volumes look on the NYMEX, each day.
Volume by time of day – Crude oil futures (CL)
That insane volume spike at 2:30 p.m. is the NYMEX close.
Many participants use Trade at Settlement (TAS) orders to guarantee the closing price on their fill and the hedging of these TAS orders creates a monster volume spike in the minutes leading up to the close. If this volume is not balanced, you will sometimes see a huge move at that time. If someone yells “What’s going on in crude!” right at 2:30 p.m., just shake your head and say “NYMEX close, dude. NYMEX close.” :]
How would you trade this? If you’re long and it rips into 2:30 pm, you cover. If you’re flat, and you wanted to be short above market because of X, Y and Z (tech levels, macro, whatever) … And oil rips higher into 2:30 pm… You sell the rip.
Or maybe you develop a model that predicts which way the flow will go and get long or short before and square up into it… etc. You predict it, you fade it, or you use it as an entry opportunity for a trade you wanted to do for other reasons. And you avoid breakout trades that trigger around that time because mean reversion is more likely than continuation.
I am not telling you to do any of these things, I am saying they are examples of ideas that might work.
PS: If someone wants to backtest this and tell me whether systematic mean reversion trading around large moves at the NYMEX close is a profitable strategy… Please do!
If you want to level up your global macro and trading XP every day, and see how I generate actionable trade ideas in real-time, click here to subscribe to am/FX. The price for new subscribers goes from $490 to $590 at the end of August—sign up now and lock in $490/year forever. Click here to subscribe.
Time of Day 3: What’s Japan doing in USDJPY?
Another example of a time of day pattern, which I briefly referenced above, is Japanese activity in USDJPY in Tokyo. Here’s the total return of USDJPY, by time zone, since 2018:
USDJPY total return by time zone, 2018 to now
Focus on the blue line, as that is the main window in Tokyo where Japanese hedgers are busy. You can see there was a profitable strategy to be long USDJPY every day in Japan time since the start of 2021. This is not a fooled by randomness situation; USDJPY rallies when oil is rallying because Japanese importers must buy USD to purchase oil. Note that blue line looks somewhat similar to a chart of crude oil:
Crude oil 2018 to now
We ran a systematic model that traded USDJPY only in Japan time for years and it produced excellent returns net of transaction costs and a high Sharpe. We also ran a flipper 2010-2016 that went short USDJPY in Japan and long USDJPY in NYC. That “flipper” was pure gold. Here’s the time of day data for USDJPY in that period:
USDJPY return by time zone, 2010 to 2016
You can see that going short the blue line and long the purple line was pretty sexy for many years. And here’s oil for the same period:
Crude oil 2010 to 2016
Same story! The flipper was turbocharged by Abenomics but the underlying driver of Japan USDJPY was still the price of oil the whole time
.
I hope those three strategies give you an idea of how time of day influences markets.
There are countless other examples. In bull markets, crypto goes up most in the first seven days of the month because inflows are driven by retail payday cycles and institutional inflows at the start of the month. Gold trades heavy around the time producers sell each day. FX markets rip or dip for no reason into 11 a.m. sometimes as mutant flows are benchmarked to that time. Option expiry can create predictable patterns in stocks and currency markets. And so on.
Understand your market at a time of day level and find an edge.
P&L by time of day
Here is a completely different way to think about time of day impacts in trading.
An extremely useful analysis for short-term traders is to look at your P&L by time of day. The way I collected this information when I worked at a hedge fund was to manually record my P&L in a spreadsheet every 30 minutes. If you can have this done automatically; that is even better. After collecting intraday data for a while, I noticed that my P&L very consistently rose from 7:00 AM and peaked around 11:00 AM. It then came off gradually until the end of the day. The chart looked something like this:
Approximate P&L by time of day when I traded at a hedge fund
I was unaware of this pattern until I started recording intraday P&L data. There is a strong logic to a pattern like this because the volatile and liquid period for FX markets in the New York time zone is 7:00 AM until 11:00 AM. After that, London goes home and things tend to die down.
Armed with the information from this chart, I started to square up much, much earlier each day. Instead of taking my risk down in the afternoon, I tried my best to reduce risk around 11:00 AM. This helped me lock in more P&L and it reduced my overall stress level because once I knew that all my trading after 12 noon was net negative, I could reduce my risk and use the afternoons for research, exercise, and other more useful endeavors. An added benefit of squaring up earlier is that liquidity is much better at 11 AM NY than it is at 4 PM NY.
This is a good example of how data collection and P&L analysis can make you a better trader.
OK, so what’s the trade here?
Tesla time of day in 2022
Given the research quoted on the meme stocks and my recent focus on trading TSLA from the short side post-split, I decided to have a look to see if TSLA follows the same pattern as other meme stocks (rally overnight, sell off during the day). It does!
Here is time of day P&L for TSLA this year:
TSLA: Cumulative average return over the course of the day in 2022
It follows the same pattern as the other meme stocks (gap overnight then selloff most of the day).
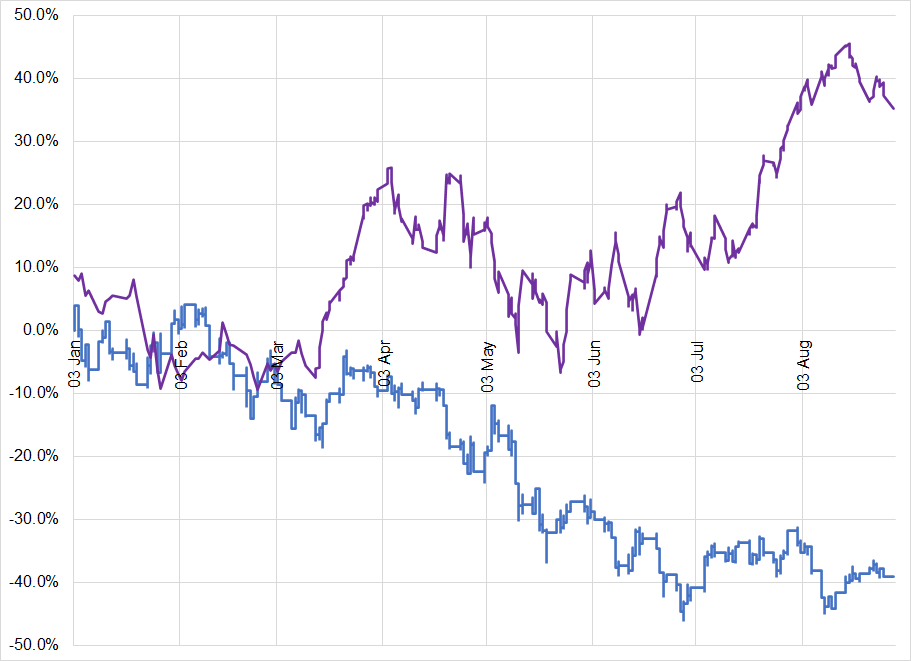
Here is the P&L of the strategy of long TSLA from 11 a.m. to the close each day (blue) vs. long TSLA from the close to 11 a.m. (purple):
Long TSLA during the day (blue) and long TSLA close to next day at 11am (purple)
If you’re bearish, it looks smart to avoid the overnight positions!
With any pattern like this, you always ask “What’s the logic?” Here, the logic is the same one described for the gap and trap earlier: Retail investors often buy stocks on the open. And TSLA is a retail-heavy stock. Note that technically, squaring up at 3:30 p.m. (a half hour before the close) yields slightly better returns but the difference is small and liquidity is best at the close.
So this week’s trade is a bit more complicated. I’m bearish TSLA post-split as I think the equity bear market has resumed after the perfect touch of the 200-day in S&P, the macro backdrop remains horrendous (central banks hiking into global recession), and TSLA keeps making lower highs and has an eventual date with the lows.
The trade this week is: Starting tomorrow, go short TSLA every day at 11 a.m. and cover at the close for the next three weeks. There are transaction costs (TC) here, but TSLA trades 10 or 20 cents wide most of the time and if you trade at mid and take a bit of execution risk, you can get in and out of TSLA for almost zero TC (not always true!!!). Relative to an average daily range of 6%, TSLA’s bid/offer of 0.05% (5 basis points) is not life-threatening.
I’m not necessarily saying this is a valid systematic strategy, but if I’m bearish TSLA, this is an (admittedly high maintenance) way to play it and remove the stupid overnight gap risks on a random headline about the Twitter takeover situation or whatever. Again, these 50in50 trades are for demonstration purposes. Trade at your own risk. Ideally, you would want to have this running systematically for much longer than three weeks but this a long enough period to collect some results and move on.
While I am stressing this is an example, there are many systematic trades like this that work very well. Like I said, we used to do tons of them in FX and they delivered good returns and a good Sharpe. Transaction costs can sometimes be a challenge.
Another challenge: This type of trade is hard to size and risk manage. There is a whole field of study on sizing and risk managing systematic trades like this, but I’m going to keep it as simple as possible.
TSLA’s average daily range is 6% and you can’t really put a tight stop on stuff like this. In fact, adding stop losses to systematic strategies almost always leads to lower returns. So I’m gonna set this one up as follows:
Max risk per day = $300
Max risk total = $2,000. So if the strategy loses $2k, it gets turned off.
Stop loss 10% away from entry point each day so there is some risk management but the odds of getting stopped out are low.
Taking today’s price as an example: $284. A 10% move is $28.40 therefore we will be short 10 shares because 10 X 28.4 is $284.00 (as close as we can get to $300 using a whole share number). Stop loss at entry point plus 10%. Cover at the close.
The strategy will start tomorrow and the last day it will trade (if it doesn’t blow through the full $2,000) will be 20SEP22. That is the day before the FOMC meeting. Running a strat like this through FOMC is ill-advised.
.
This might be stupid. It’s an experiment. Let’s see how it goes. I will create a spreadsheet and track this bad boy for the next few weeks and see how we do. I will also compare this strategy to simply straight-up shorting the stock with a stop loss at $315.50 (above the recent highs).
Conclusion
Time of day matters. There are good times of day to trade, and bad times. There are common traps that lead to bad outcomes for traders and investors who don’t know what they are doing—traders that leave BUY AT OPEN orders, for example. There are ways to find an edge trading time of day patterns.
Identifying time of day patterns will:
Help you find edges to trade
Help you save money by avoiding leaks
Focus your effort on trading the most lucrative times of day
Open up new avenues for analysis and investigation
Give you some basic insights into how systematic trading works
.
Understand the patterns, regularities, anomalies, signals, and noise at various times of day and you are on your way towards better short-term trading.
That's it for today. Thanks for reading! If you liked this post, please click the heart icon thingy.
And don’t forget to do the quick survey. SURVEY LINK
Trade at your own risk. Be smart. Have fun. Call your mom.
DISCLAIMER: Nothing in “50 Trades in 50 Weeks” is investment advice. Do your own research and consult your personal financial advisor. I’m putting out free thoughts for people who want to learn. This is an educational Substack. Trade your own view!
If you are passionate about learning how to trade…
Sign up for my global macro daily here
Subscribe to 50in50 for free right here.


Amazing article. Very clean explanation with charts for illustration. Thank you very much for such an in depth longer read.
Awesome article, thank you!