Hi. Welcome back to Fifty Trades in Fifty Weeks!
This is Week 30
50in50 uses the case study method to go through one real-time trade in detail, about once per week. This Substack is targeted at traders with 0 to 5 years of experience, but I hope that pros will find it valuable too. For a full description of what this is (and who I am), see here.
If you want to learn about global macro in real-time … subscribe to my daily: am/FX
Listen to this as a podcast on the web … or Spotify … or Apple.
Update on previous trades
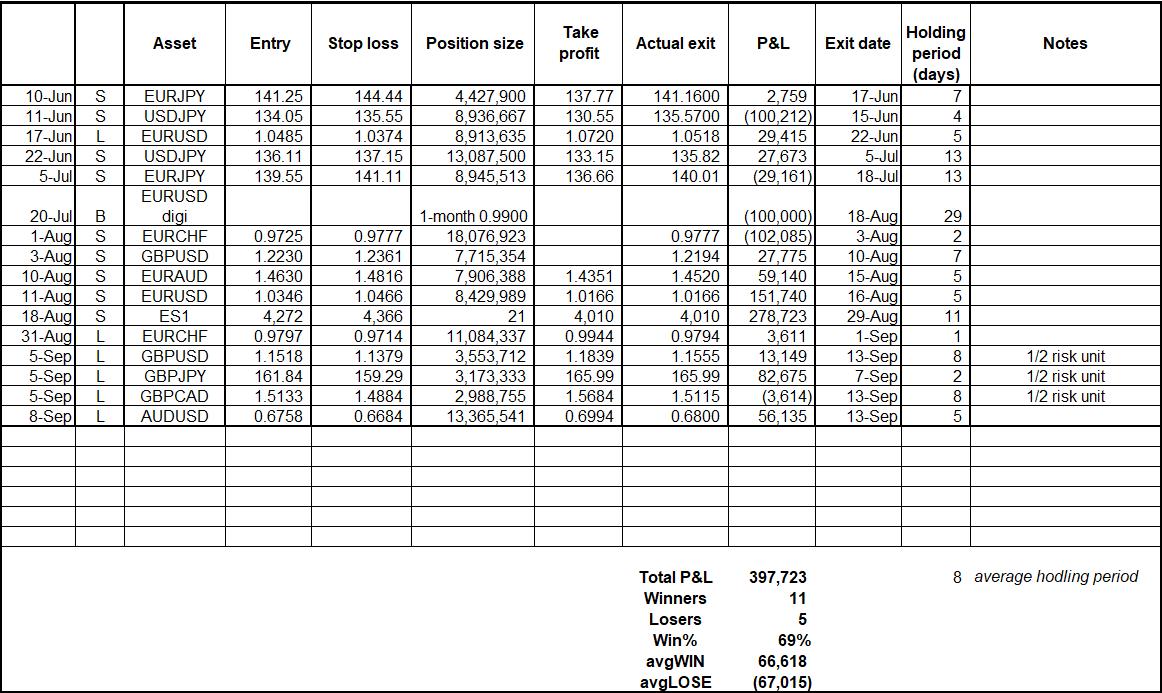
It’s time for the once-every-ten-week update on the 50in50 trades. Squaring up the buy the rumor / sell the fact ETH trade last week was a big mistake. Here is the spreadsheet of trades since the last update:
Week 20 to Week 30 results
The MSTR short was the only trade that really moved the needle as it showed what a well-timed, high-leverage trade can do. Overall, the low leverage of the trades (using just 2% of capital) means the volatility of the P&L is going to be low. Risking 2% of free capital is a very conservative approach and often the best approach for new traders.
For reference, here is the quarterly update for my real-time trades in am/FX. My assumption has always been that the 50in50 trades would have less edge than my real trades because FX and global macro is my expertise and many of the single name equity trades I do in here are for example purposes and not necessarily reflective of a setup where I have an identifiable edge.
am/FX Trade Ideas: Quarterly Results June to September 2022

The hit ratio is much better in my real trades, as one might hope or expect.
If you would like to receive am/FX in your inbox every day and get my global macro thoughts, live trade ideas, and some random silliness… You can subscribe here.
OK, update complete. Let’s talk global macro!
Trading Global Macro
Sitting down to write a 2500-word Substack about trading global macro is a bit like sitting down to write a 2500-word essay titled “Everything you need to know about religion” It is such a broad topic that one could write two full books and still not cover everything. I mean… I did that. I wrote two books and still didn’t cover everything!
So today, I’m going to run through a sample trade, much like I did in Chapter 12 of Alpha Trader. But here I’ll use an example of a trade that I wrote about this morning in am/FX. The idea covers multiple facets of global macro, including trade idea generation, technical analysis, positioning and sentiment, correlation, and more.
I hope a specific example will give you a sense of how I look at markets. Then, think about your own style, and how you can develop a process of your own to understand, and profit from macro trading.
By the way, if you want to keep up to date on global macro, I recommend you read:
My daily (am/FX)
Macro Alf’s Substack, and
.
These three publications will give you a solid understanding of the big, medium, and tactical/micro picture.
My Trading Philosophy
My philosophy is to look at the big picture, but trade the evolution of that picture, and not the picture itself. In other words, I focus on changes and perceptions as much as, or more than current reality. This is an essential distinction because market prices are formed at the margin by the changing expectations of a broad range of participants. There is money to be made by anticipating those changing expectations.
It’s not about whether interest rates (yields) are high right now, for example… It’s about:
Are yields going higher from here?
Do people generally expect them to go higher?
Do market prices in other markets accurately reflect the high level of yields and the rate of change of higher yields? (Changes matter. Speed of change also matters.)
How much higher would rates have to go to change the minds of the skeptics who think these high yields are transitory? That is, where would the doves capitulate?
How far would yields have to fall to shake the confidence of those who are already positioned for higher yields?
How big is market positioning in the direction of higher yields?
What proximite events or catalysts might move yields higher or lower from here? How will people increase or reduce positions as the events near? Is there an asymmetry around these events or catalysts where prices might move more aggressively in one direction?
.
My process is not really about forecasting where the economy is going… It’s about understanding where the economy is now (the reality), where people think the economy is now (the narrative), and studying the array of market prices to find discrepancies, dislocations, or places where I see a mispricing or asymmetry. Then, I try to anticipate changes in the reality and the narrative, and predict where prices will move as this interplay between reality and narrative evolves.
The questions I am always asking: Where are we? Where are we going? Where do people think we are going? What do other people think other people are thinking? How does my view diverge from everyone else’s view? Is there an opportunity to profit if I am right? How much will I lose if I’m wrong?
Sounds complicated, right? It is! There is no simple ABC way of trading global macro. It’s a huge crazy puzzle with different pieces every day. It’s hard. That’s what makes it fun. Nothing worth doing is easy at first.
My Trading Framework
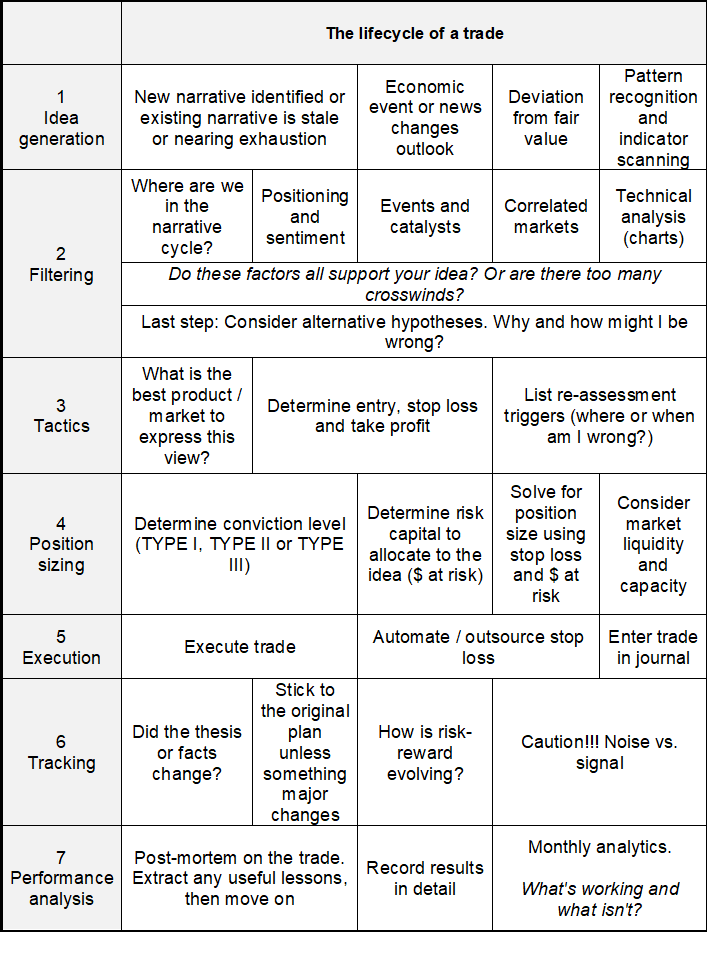
This is the basic framework I use for trading:
Today’s post is mostly about 1: Idea generation. How do you come up with global macro ideas? In FX, trades often revolve around economic or monetary policy divergence. Because every FX trade has a numerator and a denominator, you are comparing the state of macro in one country vs. another. In today’s trade, I am looking at USDJPY.
The current narrative in USDJPY
USDJPY has been skyrocketing all year on the divergence between US and Japanese monetary policy. All other things being equal, investors would rather own a currency with high rates, not low rates. US 10-year bonds at 3.6% are much more fun to own than Japanese bonds (JGBs) at 0.25%. Here is a chart of USDJPY (black) vs. US 10-year yields (blue) since the Fed dropped “transitory” last November.
USDJPY vs. US 10-year yield
You can see the blue line, US yields, went from below 1.0% to 3.6%. Now here’s Japanese 10-year yields during that same period.
Oh, they went up too! From 0.08% to 0.25%. Lol. So while US yields increased 2.6% (260bps*), Japanese yields went up 0.17% (17bps). The reason for the tiny move in Japanese yields is the Bank of Japan has instituted a policy called Yield Curve Control (YCC) where they cap the 10-year yield at 25 basis points.
*A basis point is 1/100 of a percentage point. So 25bps = 0.25%.
You can see in the first chart that the blue line (US yields) tracks USDJPY very well. As investors expect or see a higher yield in the USA, they buy more USDJPY. When that yield premium looks like it’s at risk, they sell USDJPY.
There are leads and lags and this sort of observation leads to a type of trading called lead/lag or intramarket or correlation trading. That is a separate topic for another 50in50 but my point here is to show you that the direction of US yields is a critical determinant of the direction of USDJPY.
Knowing this, one might expect that USDJPY would be at the highs right now, but it’s not. It’s close, but not quite there because of two main factors:
The Japanese Ministry of Finance (MOF) has been complaining about the weak yen and threatening intervention.
The Fed and BOJ both meet this week and there is a risk that the BOJ removes the 25bp cap on yields. If the BOJ removes YCC (the yield cap), USDJPY will probably go down as that would diminish the US yield advantage over the yen.
.
The setup
People are worried about the MOF and event risk, and have little to no topside exposure in USDJPY. This creates an interesting setup where the momentum in the critical correlated market (US yields) continues, but the correlated pair (USDJPY) is stalling as people worry about muddling from policymakers.
This creates an opportunity to go into the BOJ and Fed meetings long USDJPY on the view that once the events are out of the way (and BOJ governor Kuroda keeps YCC capping yields at 25bps)… USDJPY can rip. This requires one to believe the following:
BOJ will not move the yield cap. My experience is that leaks ahead of BOJ meetings (of which there are plenty!) are usually pretty accurate. Here are two recent sources stories: BOJ is nowhere near shifting monetary policy to support yen (Reuters) and BOJ set to end COVID-relief plan, but no change to loose policy (Japan Times).
The Fed will not be dovish. My view is the Fed will hike 75bps and sound somewhat hawkish as inflation becomes stickier and they are still wildly behind the curve. High inflation requires tight policy (that is, a Fed Funds rate above neutral) and the Fed is still running loose policy. It has been more than a year of sky-high inflation and yet the Fed (despite some big hikes) is not even at neutral yet.
The market is not all-in long USDJPY already. If the macro setup is bullish but everyone is already in the trade, the opportunity is less interesting. You want a view that isn’t already fully subscribed. Long USDJPY is barely subscribed at all because people are afraid of the MOF and are positioning in lotto tickets (USDJPY puts) for an end to YCC. The market is the wrong way if USDJPY rallies from here.
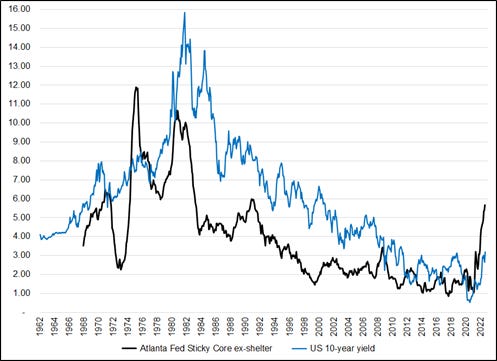
Yields will not reverse to the downside. Here is sticky core inflation (ex-shelter) vs. US yields. I believe that pressure on yields will remain high until we see real signs of falling inflation. Everyone is hoping for peak inflation because of commodities and supply chain improvements but it looks like inflation is about much more than just commodities or rent at this point.
Atlanta Fed Sticky Core ex-shelter (black) vs. US 10-year yield (blue)
.
I always prefer trades where I will know almost right away if I am right or wrong and with the BOJ and Fed meetings this week… This trade should resolve one way or the other pretty quick.
Technicals
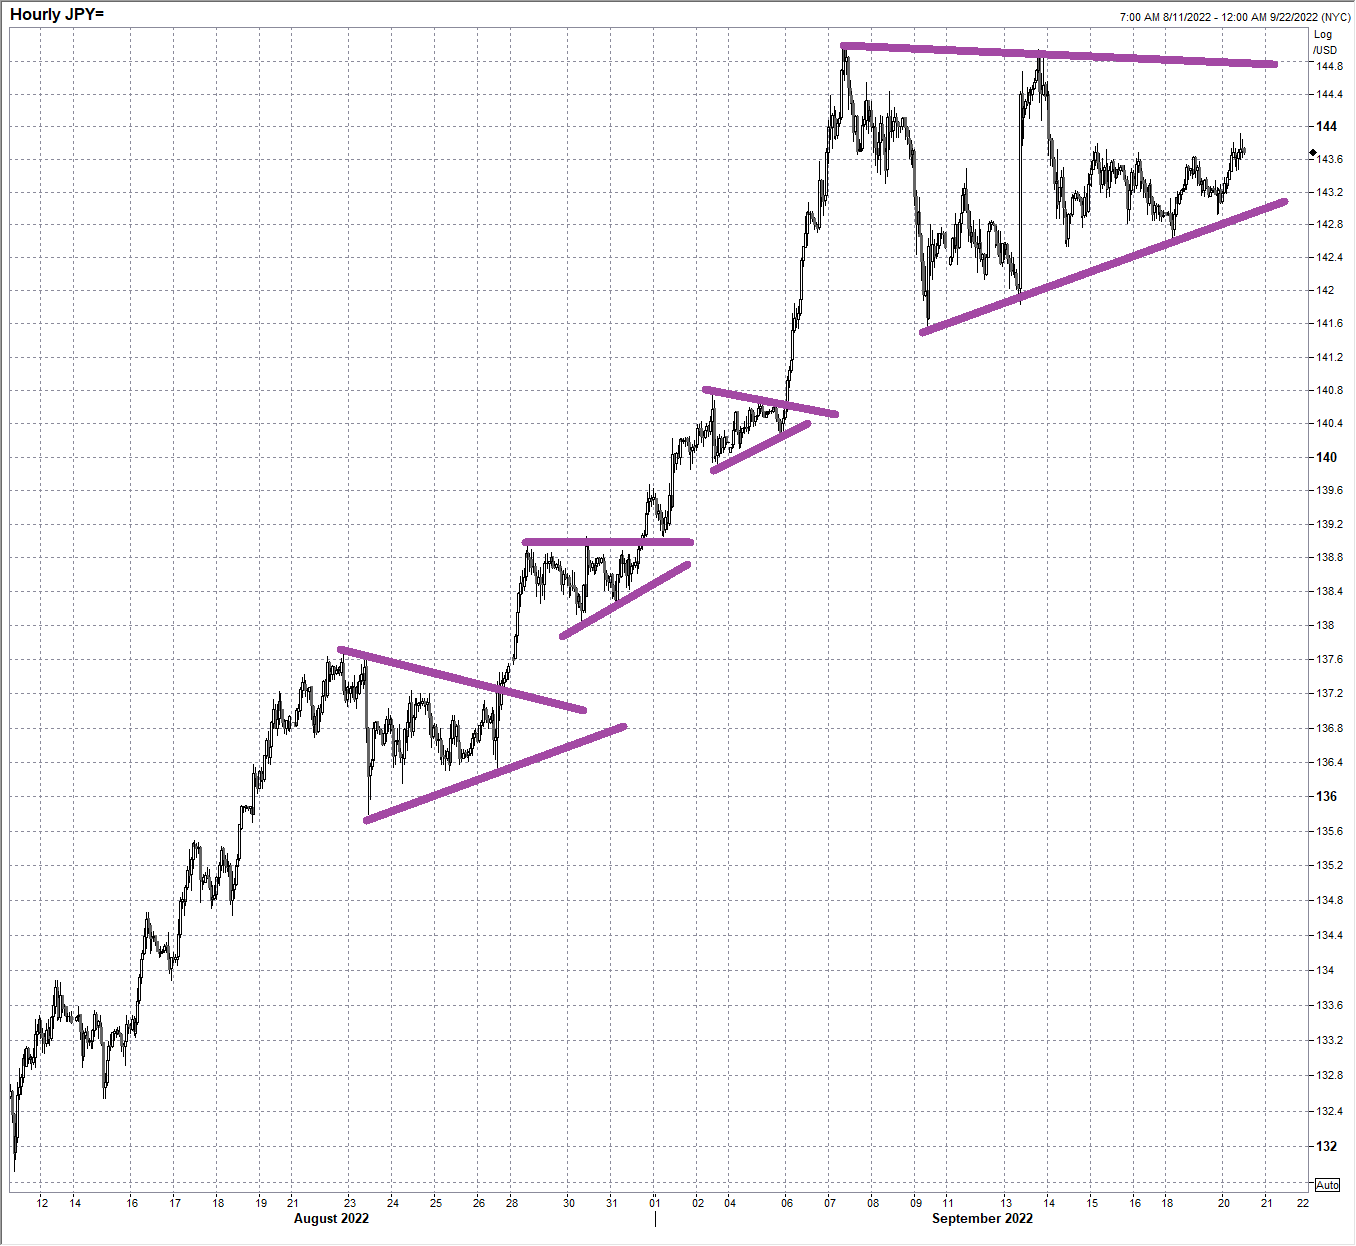
Once I have a global macro trade idea, I turn to the charts for tactics and risk management. USDJPY is famous for its triangular consolidations, so when I put up the chart and see this…
USDJPY hourly since early August
… I’m like: Sweet! In case you weren’t following USDJPY from 2012 to 2015, that was the period in which the BOJ did massive easing and you can see it was triangles, all the way up:
USDJPY daily 2012 to 2015
I am not sure why USDJPY hangs out in so many triangular consolidations during big up trends of every fractal, but it does. Therefore, the triangle on the hourly chart above is encouraging.
The beauty of these triangles is that they make risk management relatively straightforward. You go long here (143.65) with a stop somewhere below the 14SEP low of 142.58 and the bottom of the triangle.
I am using 141.74 as my stop loss to allow for a little excess volatility around this week’s central bank fest. If the BOJ were to move YCC, there is gap risk, but I think you would probably get out somewhere on a low 141 handle.
Reassessment triggers
It’s important to list your reassessment triggers ex-ante (before the fact) so that you are ready if the alternative hypothesis (you’re wrong) happens. Here are my reassessment triggers:
If the BOJ raises or removes the YCC policy, get out. This will mean hitting the first bid available or leaving a stop loss in a system and praying for the gods of trading to be merciful.
If 141.74 trades, the idea is wrong. That’s the stop loss.
If the Fed is dovish, I will not reassess, I will try to ride it out while maintaining the 141.74 stop. A dovish Fed is just more behind the curve and I do not think the market will find such dovishness credible for more than a day or two. Therefore, the dip in USDJPY on a dovish Fed could be temporary and so I don’t want to cut in that case.
.
Conclusion
With this week’s central bank meetings and the recent consolidation near the highs in USDJPY you have:
A good macro story (higher yields, higher USD) with minimal participation at the moment due to upcoming event risk.
US yields making new highs, which provides cross-market confirmation for a higher USDJPY view. Small deviation from fair value with yields at the highs and USDJPY 150 points below the highs.
Bigger picture positioning light due to fears of MOF intervention. My view is that we don’t need to worry about the MOF here at 143.65. When you know people are avoiding a trade because of a specific risk, and you are willing to take on that risk yourself… That’s a good situation.
Chart pattern of ascending series of triangles continues. Risk management parameters are thus fairly clear. Leverage is decent, though not epic, because I need to leave some room for volatility around the central bank meetings and I need to manage the gap risk if I am wrong about the BOJ and YCC.
Two major events (BOJ and Fed) that will let me know quickly if I am right or wrong. Winning or losing quickly is a benefit as it frees up your capital (mental and financial) for other trades instead of locking you into something that drags on for weeks.
.
There are many, many ways to trade global macro. I like to identify short-term opportunities where I anticipate different outcomes than the consensus or where I feel I have an edge in understanding why the prevailing narrative is probably wrong. Every trade is probabilistic… There are no sure things, ever. But if you can identify a series of 50/50 bets that pay 2:1 or 60/40 bets that pay 1.5:1 or 70/30 bets that pay 1:1… Over time you will make money.
If you liked this week’s 50in50, please click the like button. Thanks.
That's it for today. Thanks for reading! If you liked this post, please click the heart icon thingy.
Trade at your own risk. Be smart. Have fun. Call your mom.
DISCLAIMER: Nothing in “50 Trades in 50 Weeks” is investment advice. Do your own research and consult your personal financial advisor. I’m putting out free thoughts for people who want to learn. This is an educational Substack. Trade your own view!
If you are passionate about learning how to trade…
Sign up for my global macro daily here
Subscribe to 50in50 for free right here.


Brent, such a cool piece again. Question though; How do you know, that ... “People are worried about the MOF and event risk, and have little to no topside exposure in USDJPY. “
From COT report ?
Ps will buy your alpha trades. book.
Brent, nice piece! Given your expectation of a break out of the triangle pattern along with the risk of a change in stance by the BOJ or the FED in the coming days, would it not be better to look at trading long USDJPY via options, rather than cash?