
Week 47: Where should I put my stop?
Some basics on determining the appropriate level for a stop loss

This is Week 47
50in50 uses the case study method to go through one real-time trade in detail, about once per week. This Substack is targeted at traders with 0 to 5 years of experience, but I hope that pros will find it valuable too. For a full description of what this is (and who I am), see here.
If you want to learn about global macro in real-time … subscribe to my daily: am/FX
Listen to this as a podcast on the web … or Spotify … or Apple.
Update on previous trades
Nothing significant to report other than the SPY put spread is smalls underwater and the TSLA short is bobbing around aimlessly with a bit of a bearish bias.
Friday Speedrun!
We have a new, 5-minute-per-week Substack coming out! It’s called “Friday Speedrun” and it starts April 7.
.
Are you…
A business student?
Studying economics or finance?
A junior analyst in sales, trading, or banking?
Curious about financial markets and want to learn more?
.
If you answered “yes” to any of the above, Friday Speedrun is for you.
Get a clear explanation of what happened in global markets each week from a 25+ year Wall Street trader and global macro expert (me) and contributing editor Justin Ross.
It’s free, easy, and quick.
Five high-yield minutes each week.
SIGN UP HERE (it’s free)
… and even if you aren't interested in finance, we're going to share links to interesting articles, blogs, etc. every week so you can read what we've been reading.
Get smarter, learn more.
Where Should I Put My Stop?
One of the most frequent questions I get from new traders is “Where do I put my stops?” It’s an important question and can often be the difference between a W and an L on a trade. It’s critically important to understand that forecasting the direction of a market is just the very, very start of making money in trading. Tactics and trade structure can influence your P&L as much or more than trade selection and idea generation.
As we are through 46 Weeks of 50in50 so far, I want to use these last few weeks to cover any important topics that I have not yet hit. If there’s something important you feel I have left out, please let me know. I will do “position sizing” next week, so anything other than that.
Today, I’m specifically discussing where to put stop losses, but all the same concepts apply to where you put your take profits. Use the same two-step method for TPs.
A simple method for determining your stop loss
Once I have come up with a strong trade idea, usually through some combination of narrative analysis, catalysts, positioning, and cross-market analysis, the next thing I think about is where to put the stop loss. You want your stop loss to clearly tell you “My idea was wrong” and not be more like “There was some noise and chop, so my stop got hit.”
Every time you choose a stop loss level, you are navigating the tension between maximum position size and leverage vs. the probability of getting tapped out by noise. Tight stop = max leverage. Tight stop = riskier.
If you are getting stopped out all the time, that’s a clear indication that your stop losses are too close. That may sound obvious to some, but it’s something important to keep in mind. If you hear yourself saying: “Man, I’m right a lot lately, but I’m losing money,” that could well mean your stops are just too close.
When in doubt, use a wider stop.
Better to be too small and alive than big and dead.
There are two basic steps when determining your stop loss and you need to do both to optimize your tactics.
Step one: Do the math
The first method is to understand the volatility of the product you are trading and how that relates to your trading time horizon. When volatility is higher, you need smaller positions and wider stops, percentage-wise.
I tend to trade with a time horizon of one hour to one week, with many trades in the 3-to-5-days-long category. As such, I’m using hourly charts looking back about three months and looking to catch a decent 3-day move. While I hate when people religiously use 1:2 or 1:3 as their risk/reward ratio, somewhere in there is a good starting point.
So if I’m looking to catch a good 3-day move, and I want, on average, trades that pay 2/1 or 3/1, my stop loss should be approximately 1.0X to 1.5X an average daily range.
You should always know the average daily range of anything you trade.
This is trading 101. If you don’t know the average daily range of an asset you are trading, that is not good. If you are trading a micro fractal (day trading, for example), you should also know the average hourly and 4-hourly range for your product because everything I am writing about today works on every fractal. Day traders can use tighter stops because their targets are closer. Swing traders should use wider stops because their targets are further.
It’s also helpful to know the distribution of daily ranges because the average camouflages a ton of important information. For example, there is a skew to the average daily ranges in risky assets like SPX and USDJPY. They go down faster than they go up. You can build a histogram of daily ranges in Excel using daily data extracted from wherever.
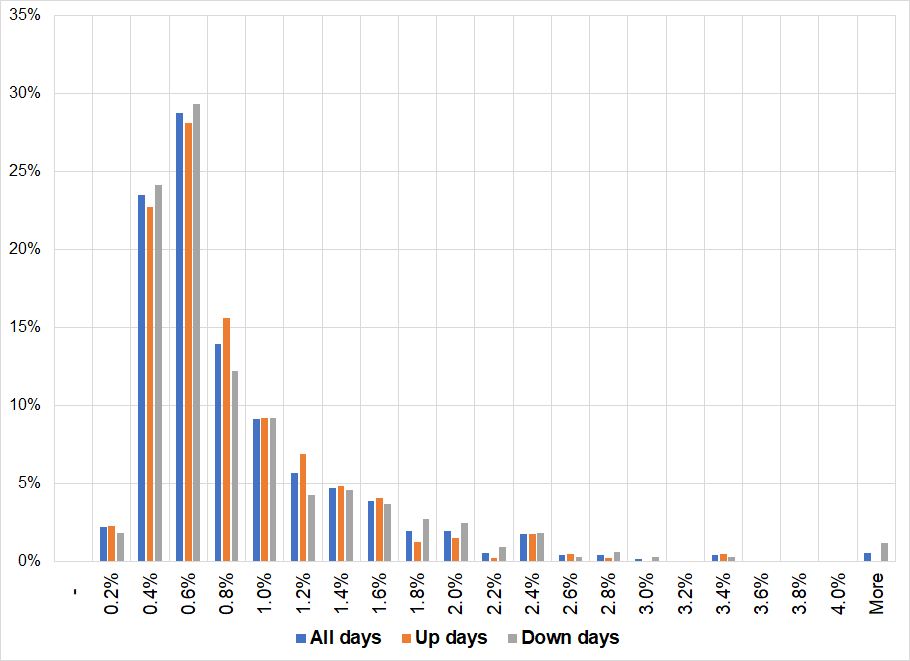
I trade a lot of USDJPY; here’s my histogram of USDJPY ranges. I used two years of data but keep in mind that regimes change and they can change fast. Changes in volatility are more important when considering position sizing than when thinking about stops, but they always matter.
USDJPY: Histogram of daily ranges in the past two years
.
A few things stand out here.
While the average daily range is 0.78%, most days are closer to 0.4%-0.6%. If you are expecting a typical day, you could use 0.5% or 0.6% as your expectation when determining the stop loss because the outliers skew the average significantly.
Down days are slightly bigger than up days. The difference is not big enough to worry about when setting your stop, but it’s good to be aware of this feature of the market.
Ranges are not normally distributed. Most ranges are average and then abnormal days can be epic.
.
So if I’m buying USDJPY with a target of 1.5% (three normal day’s ranges), a rough starting point for my stop is going to be my entry minus one day’s range (0.5% to 0.6%). This is assuming volatility is normal right now and I have no reason to expect a huge surge of vol.
If I was holding this position through a major event, the determination gets way more complicated because then you have to estimate how much USDJPY normally moves on an event like the one that’s about to happen. To do this, you can look at historical data, but that’s getting a bit beyond the scope of today’s note. There are many exceptions to the general approach I am outlining today, but it works in most situations.
What we are trying to do with these volatility measures is answer the question: “What is a reasonable stop loss given my target, time horizon, and entry point?”
So if USDJPY is 131.05, my starting point here is:
Target = 3X a normal day’s range. If I have decided 0.5% is a normal day, then my target is 133.02. That’s 131.05 X 1.015.
Stop loss = 1.5X normal day’s range. That is 131.05 X (1 - (0.50% X 1.5)) = 131.05 X 0.9925 = 130.07.
Again, I really want to emphasize. This is kind of a rough starting point for what makes sense. Your estimate of volatility going forward, over the life of the trade, is critical here. When there’s nothing special going on, using the mode or average or median range makes sense.
But now, keep in mind those levels are totally arbitrary. They don’t take into consideration anything about the reality of the market. They are just a mathematical approximation of what makes sense.
Step two: Do the techs
OK, so my rough estimate says stop at 130.07 and take profit at 133.02. Now, I will look at a chart. Today’s lesson is not about technical analysis, but the main things I’m looking for are:
Horizontal lines (support and resistance)
Equilibrium zones
Moving averages
.
Here’s the USDJPY chart right now.
USDJPY hourly with 120-hour and 240-hour moving averages
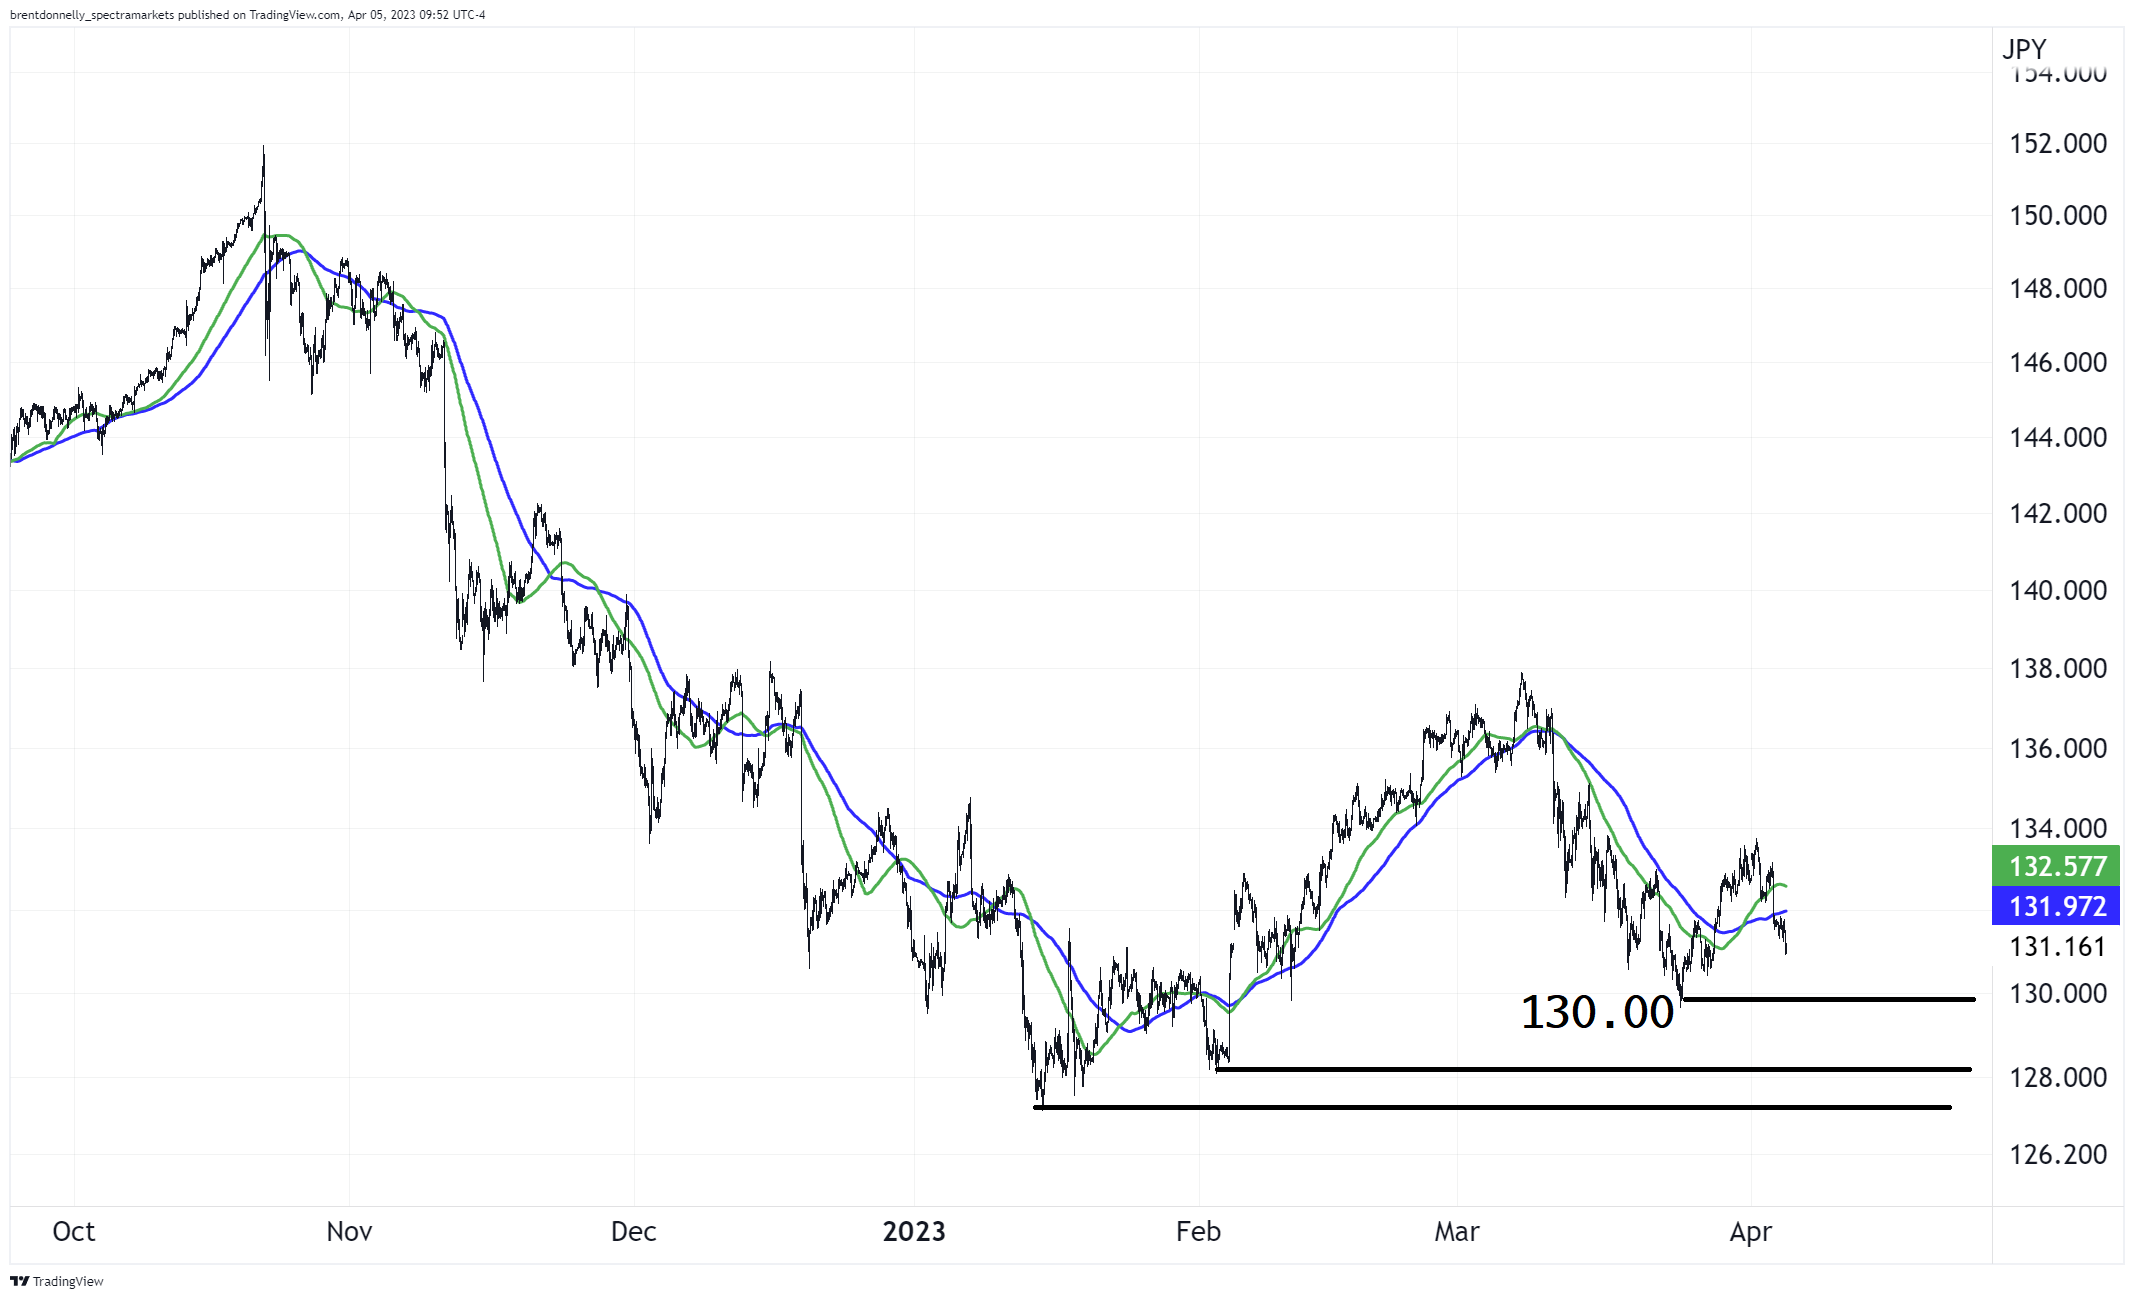
So for the stop loss, it’s pretty easy. We have a major low right at 130.00. My first instinct looking at this chart is that I might want to wait to get long closer to 130.00 to get better leverage, but let’s just say I have some reason to think it’s going to go up soon. Maybe US 10-year yields are ripping or whatever.
Please note in real life I am bearish USDJPY right now and yields are going down. This is just an example.
I have mentioned this before, but it’s useful to know that round numbers are more likely to hold than other points on the chart. So we always want our sell stops below the round numbers. My calculation suggested 130.07, but of course given round number bias and the support at 130.00, we want to go below there.
Read more about round number bias here.
Now the issue is that everyone looking at this chart is going to want to leave stops on long positions below 130.00. So if you put your stop at 129.97, you are going to get stopped out with everyone else. If you know your market, you want to put your stop a few spreads below the obvious place so that at least if those stops get wiped and it rebounds, you’re OK. So in this case, I would use 129.74, which gives it enough room.
So that’s it, really. You calculate a range of reasonableness and then you adjust based on technical analysis. You don’t always need to use 2:1 or 3:1 as your ratio. Really you should be thinking in expected value terms so the estimated probability of winning needs to be factored in, as well. If you think you can risk one to make one on a trade and you see an 80% chance of it working… That’s a good trade!
Read more about expected value here.
Short KRE
KRE is the US regional banking ETF. Without getting too far into the weeds on US regional banking… Things don’t look great. The regional bank stocks are not bouncing, FRC is still near the lows, and more cockroaches are emerging and are likely to emerge. Western Alliance issued a worrying update today, for example.
So let’s just say we want to get short KRE. Where do we put the stop?
First, it’s important to consider that KRE has entered a new, higher volatility regime since the fall of Silvergate. You can’t look at data before this new crisis, because it will give you totally useless information. The big gap down in KRE was March 9, so let’s look at the distribution of daily ranges since then.
KRE: Histogram of daily ranges, before and after SVB

Obviously, the sample size post-March 9 is small, but you get the idea. Daily ranges were 2%-3% and now they are 6%-11%. So let’s say we want our stop 1.5 X 7%, to be somewhat safe-ish. That’s 10.5% above the current price of 42.00 and thus: $46.41. Let’s have a peek at the chart.
KRE hourly chart

Those two highs are 46.44 and 47.51 and the third one is 49.44. The third one is way too far away given my estimate of what’s reasonable, so in this case I would put my stop at 48.06. That’s farther than the math suggests but the volatility of volatility is very high in KRE and so wider is better than closer. You might be tempted to put the stop above the 240-hour MA and megatop there around 50.00 but that is just too far away because my target is 33.10, so I can’t be risking 9+ to make <8.
You could also consider a tighter stop at 46.10 (above the moving average and more recent double top). That would give you better leverage but in a crisis market, I would rather survive and make less money than get dinged on a random headline.
Conclusion
50in50 goes short KRE at 41.60 with a stop at 48.06. Take profit 33.10. Risking 6.46 to make 8.50. I think this probably has a 65% chance of working, so I’m happy with the thin upside vs. downside ratio.
Remember: I’m not telling you to do these trades. This is an educational Substack. The concepts are the thing, not the trade ideas. Always trade your own view.
Final note, this is a textbook bear flag in KRE. So that helps too.
Don’t forget to sign up for Friday Speedrun.
If you liked this episode, please click the LIKE button. Thanks!

My global macro daily is here
And this is my Twitter
DISCLAIMER: Nothing in “50 Trades in 50 Weeks” is investment advice. Do your own research and consult your personal financial advisor. I’m putting out free thoughts for people who want to learn. This is an educational Substack. Trade your own view!
Great post! How do you factor in overnight risk? Using true average range?
Also if the trader operates on say 5 min charts, does the same method apply when setting stops e.g. step 1: figure out 1.5x the ATR of the 5 minute bars; step 2 now look at technical levels on the 5 min chart.
Thanks again