


Week 45: Regime Flux
Adapt to (and predict) market regime change

This is Week 45
50in50 uses the case study method to go through one real-time trade in detail, about once per week. This Substack is targeted at traders with 0 to 5 years of experience, but I hope that pros will find it valuable too. For a full description of what this is (and who I am), see here.
If you want to learn about global macro in real-time … subscribe to my daily: am/FX
Listen to this as a podcast on the web … or Spotify … or Apple.
Update on previous trades
Week 37: XOM put spread is doing nada.
Week 38: Sell vol in MSTR has been good so far.
Week 39: Sell 2-month USDJPY and buy 6-month USDJPY. This has been a good idea so far. USDJPY is higher vs. entry point, which is fine.
Week 42: Ford is about unchanged. It’s flying around.
Week 43 and 44: Short TSLA doing better but not great.
Regime Flux
In Week 18, I wrote about Macroeconomic regimes. Specifically how to identify and trade them. This week, let’s talk some more about macroeconomic regimes but also get into volatility and trend vs. rangebound.
Knowing what volatility and trend regime you’re in is an absolutely critical concept and I don’t know why I waited until Week 45 to write about it. Excellent traders are highly adaptable, understand the current trading regime, and have one eye on the horizon for regime change.
One of the reasons the markets are not yet completely dominated by computers and the big reason that humans still exist on market-making desks at banks is that algos are not great at detecting and switching regimes, especially when a regime arrives that is not highly similar to something in the algorithm’s history or playbook.
The day EURCHF dropped from 1.2000 to 0.8500 as the Swiss National Bank executed the craziest rug pull in FX history, I can guarantee you that there was not a single algorithm in the world that was programmed for that. The algos holstered their lasers and hid under the desk, leaving the humans alone to fight it out with cudgels, maces, and hand axes.
The primary trading regimes
You can usually put an X in this diagram to identify the primary regime.

There are other features that define a trading regime, particularly liquidity, correlation, and positioning, but those tend to be outputs of the primary regime as determined by the grid.
For example, correlation is usually high and liquidity is low in times of raging volatility or crisis. Correlation is lower in quiet markets. Positioning gets increasingly extreme during trends and megatrends and is less prone to extreme readings when things are rangebound. And so on. This is not always true, but it’s mostly true enough.
Let’s talk about trend first, then volatility. About a third of this week’s lesson is excerpted from my book, Alpha Trader.
Rangebound vs. Trending
The main distinction to make here is rangebound vs. trending, but it’s useful to have a third category called “megatrend.” I will discuss megatrends a bit later.
Rangebound markets favor mean reversion strategies (buy low/sell high) while trending markets favor breakout or “go with” strategies (buy high/sell higher). You should always have a good sense of whether each market you trade is trending, rangebound, or neither. You can still trade mean reversion in trending markets but you should be cognizant of what you’re doing.
It is usually straightforward to figure out whether a market has been trending or rangebound. Start by looking at the chart and making a subjective, common-sense assessment. Sometimes a rangebound or trending market is easy to identify at a glance. The harder part is identifying when the market is transitioning from one to the other.
Another simple way to identify the range or trend status of a market (and a possible change) is with technical analysis tools. I prefer simple technical analysis to more esoteric methods, so here are a few simple approaches to gauge whether a market is rangebound or trending (note that this methodology is suited to short-term trading with a 1-hour to 5-day time horizon).
Has the price made a new 20-day high or low in the last ten days? If yes, it is trending that way; if no, rangebound.
Put a 100-HOUR and 200-HOUR moving average on an hourly chart and look at this matrix:
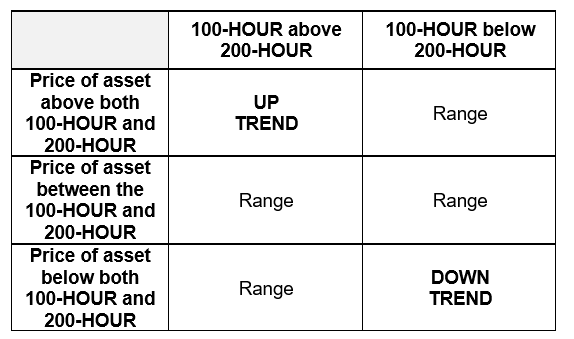
You can substitute different moving averages depending on what you find generally fits the trend of the product and the time frame you trade. If you are trading a longer time horizon you can also put three moving averages on your daily chart. Say, 20, 50, and 100-day moving averages. When they are in order it is a trend (20 > 50 > 100 = uptrend or 20 < 50 < 100 = downtrend). When they are not in order, there is no trend or the trend is weak.
Eyeball it. This sounds kind of stupid but generally, no advanced mathematics degree is required to determine if a market is trending or rangebound. Often a cursory glance at a chart (or your experience sitting there trading the market for the past month or two) reveals the type of regime.
It's not difficult to figure out if you are in a range or trend regime, but the challenge is to trade appropriately and to figure out when the regime is changing. Assume trends and ranges are somewhat persistent and wait for evidence of a regime shift before altering your approach. It is better to wait for a signal to tell you the regime has changed than to try to anticipate or front-run that regime change.
Volatility, liquidity, and trend are the three features you should always be able to describe with confidence for each market you trade. You should always know where volatility is relative to recent history, whether liquidity is good, bad, or ugly, and whether your market is in a trend or a range. If you update your view of these three variables daily, you will adapt in real time better than most of your competitors.
Megatrends
In megatrends, markets will behave differently from regular trends. For example, in megatrends positioning can often be less important or even irrelevant in the early innings because the driver of the megatrend (usually a major central bank action) is bigger than all spec activity combined.
Examples of megatrends are: The Global Financial Crisis, Abenomics, and FiscalFest 2021. It didn’t matter that everyone was short stocks in 2008 because the guano was hitting the fan with so much speed that forced asset liquidations dwarfed any speculative activity.
During megatrends, you need to run a different playbook and be much less willing to fade and trade mean reversion. Think of megatrends as an exceptional regime that comes around once every few years at the most in your market. Change your tactics and become less flexible in the early days of a huge trend driven by fresh news.
Realize no trading method works always and forever. No matter how well your methodology works right now, there is a chance it won’t work tomorrow. Be vigilant to changes in the market and monitor the success of different trading strategies.
For example, if you notice that breakout trading has not been working for you over the past two years, spend some time thinking about why. Has your methodology changed? Did you stop following your own rules? Or… Are there new algorithms doing the same thing you used to do, but faster? Are the basic breakout trading strategies such common knowledge that they no longer provide any edge? If everybody is doing the same thing, the odds are low that it will make money.
I believe that adaptation is one of the keys to survival and professional longevity in almost every industry. A good athlete adapts as her sport changes, just like a good trader adapts as markets change. Be thoughtful about the current environment, how it is changing, and how it might change in the future. Think about how you can adapt your trading to stay ahead.
As Billy Beane says to the aging baseball scout in Moneyball, “Adapt or die.”
Volatility
Market professionals call volatility “vol”. Vol is a critical part of a market’s microstructure. It is the dispersion of returns over time, usually measured as the standard deviation of logarithmic returns. In simple English: How much does the thing move?
Volatility is not constant or static. A currency pair like USDJPY might realize 6% volatility one year and 18% the next. Vol is a key concept to understand and you should always know your product’s vol profile, how it has evolved over time, and how it might change in the future.
A few things you need to know about vol:
Markets tend to be more volatile around events because equilibrium is a function of all known information, and events introduce new information and upset the equilibrium. For example, overnight vol for AUDUSD might be 8% on a normal day and 20% on the day the Reserve Bank of Australia (RBA) meets. Facebook trades with higher vol on earnings day relative to other days.
Volatility within and across markets is correlated. If equity volatility is exploding higher, it is likely that FX, bond market, and commodities volatility will go up too. There is often a single factor driving volatility in capital markets. This can be economic uncertainty, geopolitical drama, or something else. Volatility and uncertainty are usually associated.
It is hard to make money trading low-vol markets. Most traders make more money when things are moving. One of the keys to success in trading is identifying the vol regime and adjusting your trading accordingly. You probably won’t make money trading breakouts when the VIX is at 11. You probably can’t trade mean reversion when the VIX is at 80. My P&L is highly correlated to volatility. If you notice a meaningful drop in volatility in something you trade, consider trading something else or monitor the situation closely and see if your P&L is drifting lower along with vol.
.
To be 100% clear, when people talk about volatility, they usually mean historical volatility, but it is important to understand the two different types:
Historical volatility. This is the dispersion of returns in the past. You can measure it different ways but unless you are an options trader, I wouldn’t worry about where the number comes from. Just know that when people say “volatility” they are mostly referring to daily historical or realized volatility. The amount the security has moved around in the past, based on daily data.
Implied volatility. This is the market price for volatility going forward. This measure is used in option pricing, and is a better proxy for future volatility than historical volatility. The distinction is not important here and for the purposes of an exercise like vol-adjusted position sizing, it rarely matters which data you use.
Adapt in real-time to changes in your market’s vol
Fast markets are temporary, but changes in volatility can be more permanent. Do you know how to size your risk correctly to reflect current levels of volatility? Does your methodology respond systematically to changes in volatility? It should. For example, higher volatility means you should be trading smaller positions. Lower volatility means larger positions.
Bad traders always put on the same position size.
Many traders are not very good at adjusting their position size and risk management strategies in response to volatility. If S&P futures are moving 1% per day, should you have the same position size or stop loss parameters as if they are moving 3% per day? Clearly, the answer is no. Actively adjust your trading as volatility changes.
The easiest way to volatility-adjust (or vol-adjust, as most professionals say) is to use a spreadsheet that determines position size and stop loss parameters based on a volatility input. This does not have to be complicated.
The figure you use for volatility adjustment will never be perfect because we don’t know future volatility until it happens. That said, there are many ways to estimate future volatility, and those estimates will generally be accurate enough for our purposes. For example, this chart shows the VIX on a given day plotted against the percent range in the S&P futures the day after:
VIX close today vs. S&P futures range tomorrow

You can see from that plot that tomorrow’s range has a strong relationship with today’s VIX. The relationship between VIX and S&P ranges is not linear or normal as you see by the many outliers. The point is not to be perfect here.
Here is a simplified but realistic example of how a trader can apply this information and use good thinking to determine position size.
Frank trades only S&P futures and has $1,000,000 in his account. He buys or sells on the open each day and risks 2% of his account ($20,000) on each trade. He does not believe much in technical analysis so he simply sets his stop loss and take profit this way:
STOP LOSS = (entry level) + (half of one average daily range)
TAKE PROFIT = 2 * stop loss
In other words, he risks half a day’s range to make one day’s range. These parameters are not unreasonable and a simple methodology like this will work in real life. The point of the example is to show that changes in volatility should change your sizing and risk management parameters.
Frank looks at yesterday’s close in VIX and plugs it into a formula in Excel. Here is Frank’s risk in six different volatility regimes:

You can see here that as volatility rises, Frank takes smaller positions. If he normally trades 50 e-mini contracts and market volatility falls substantially, he will find the volatility of his P&L falls if he doesn’t adjust the number of contracts he trades. In contrast, if he sticks with the same number of contracts and the same P&L parameters as volatility rises, he will get stopped out of good trades all the time before they have a chance to work. All other things being equal, the probability that your trade hits its stop loss level is a direct function of volatility.
I cannot emphasize this enough. Your position size should change as volatility changes. This is the easiest and most automatic adaptation you can make as markets change. VIX is the most popular measure of equity market volatility. 10 is very low. 80 is extremely high.
Macroeconomic regimes
You’ve got your volatility and trend/rangebound regime and then you have your macroeconomic regime. A significant error that specialists and micro traders often make is to know everything about their product (say, BTC or copper, for example) and not enough about macro. Whether or not you nail the supply/demand story for copper or the institutional adoption story for bitcoin doesn’t much matter if there are larger macro forces at play.
You always need to know the macro regime and factor that into your analysis so that you know what matters on the structural and cyclical side. The macroeconomic regime also has a strong impact on the trend and volatility regime.
Throughout most of 2020-2022 we were in a unidirectional macro regime where either the tide was coming in due to fiscal and monetary largesse, or it was going out due to Fed tightening. The day Powell dropped “transitory” was a flashing red beacon from the top of macro mountain announcing to everyone below that the game had changed. Here are the main regimes over the last few years.
Regimes since January 2020

These are my best approximations and there is room for debate around some of the details. The point is, that even without the benefit of hindsight, it was pretty easy to say we were in a good regime for trend following in 2020, 2021, and much of 2022 and if you followed a simple macro framework you were probably in the right mode most of the time.
Now, we’re changing macro regimes every four weeks as everyone toggles within a probabilistic framework and nobody has a clue where the economy or the Fed are going.
What macroeconomic regime are we in now?
Identifying regimes can be a combination of subjective and objective measures and you are not just observing the current regime, you are forecasting the coming regime so that you are ready for it. Your first clue that nobody has a clue right now and we may be in for some rapid regime-switching on the macro side is the number of probabilistic frameworks you see out there right now.
Forecasters and analysts are usually in the chest-pounding deterministic business of making bold predictions but the band of uncertainty around the US economy is so wide that few are making hard predictions. Instead, you see a lot of probabilistic frameworks and such.
The second clue that we may be in an unstable macro regime is that we switch narratives every few weeks. December 2022 the recessionistas were in control then January was soft landing island and February is no landing at all. In such a probabilistic regime, the market jumps on a patch of data and falls victim to extrapolation and recency bias as it assumes a new regime has arrived.
In reality, good macro traders will know it when they see it and right now, nobody is seeing it. That says to me that the recent surge in yields, the USD, and US economic confidence is ripe for mean reversion. The January inflation and jobs data in the US was strong to very strong and that triggered a significant repricing of yields and the USD.
Now, the bar is high for the February data (that comes out in March). Any sign of a return to disinflation or a move toward outright labor market weakness will be a shocker while more inflationary data will probably push yields and the USD a bit higher, but not much.
How to trade it
When looking for mean reversion, you can start with the charts. I have been writing in am/FX over the past few days about mean reversion in the USD as we approached epic levels in USDCNH, AUDUSD, and USDJPY. Here is the chart of USDJPY I published a few days ago, for example:
USDJPY right into the 100-day and 200-day moving average

USDJPY touched the 137 level and then reversed hard down to 135.25. Ideally, you want trades that are easy to risk manage and offer high leverage and when a market goes right into a major tech convergence zone, you can get in with clear knowledge of where you’re wrong. Short USDJPY into 137 was an example of that.
Another dynamic I always look for is whether other markets confirm the move in the market I’m watching. Recently, stocks have sold off and risky currencies like NZD have gone down significantly but volatility has remained low. That’s a huge flashing light again. Risky assets falling usually triggers an uptick in volatility and when it doesn’t, that’s a non-confirmation.
Going forward, I think yields will struggle to make further gains and there is an asymmetry around US data where weak data will matter more than strong data because the market is leaning hard into the “no landing scenario” when the reality is probably closer to a soft landing or something weaker, eventually.
Looking at the charts, and keeping it simple, 5-year and 10-year yields are climbing towards the October 2022 highs but have not yet breached them. I like 5-year yields best for a reversal but generally yields all move together so when you’re making directional bets in bonds on an economic data view, the outcome is often not sensitive to the duration you choose. It can matter, but it’s rarely the difference between winning and losing.
US 5-year yield

In ETF land, you can pick SHY or IEF or TLT and accomplish similar results. There is important nuance to picking the right duration but for this piece, today, I am ignoring all that and I will go long IEF here (94.80) with a stop loss at 92.44 (which will trigger if the 5-year yield makes a new high.) Again, I’m oversimplifying here. You could find smarter ways to play mean reversion in the US economic data but that’s not the point of this lesson.
Here, I’m using the simplistic approach. US economic data has overshot and will mean revert and this will trigger a reversion in bond market expectations and push IEF higher. That’s the view.
Risking a normal unit of $2,000 on the trade. Take profit at 99.49, risking 2.36 to make 4.69.
Conclusion
You need to know the regime you’re in and adapt to new regimes as they arrive. Regime can mean volatility, trend, correlation, macroeconomics, and liquidity. It can also mean other details of how and why markets move.
Bad traders have a single approach to markets and eventually that approach stops working because the market will not cooperate forever. Good traders adapt and do what the market is rewarding.
That's it for today. Thanks for reading!
If you liked this episode, please click the LIKE button. Thanks!
FYI, Justin and I are working on a new education product because I know 50 minus 45 = a relatively small number … and thus 50in50 is almost done.
Stay tuned!
My global macro daily is here
And this is my Twitter
Subscribe to 50 Trades in 50 Weeks here:
DISCLAIMER: Nothing in “50 Trades in 50 Weeks” is investment advice. Do your own research and consult your personal financial advisor. I’m putting out free thoughts for people who want to learn. This is an educational Substack. Trade your own view!
Thanks Brent, It's great!
Thank you for the great lessons, Brent!
May I check if there is typo error with the number 80 in the statements below? Is it supposed to be 8 as you were describing low-vol markets.
"It is hard to make money trading low-vol markets. Most traders make more money when things are moving. One of the keys to success in trading is identifying the vol regime and adjusting your trading accordingly. You probably won’t make money trading breakouts when the VIX is at 11. You probably can’t trade mean reversion when the VIX is at 80."