


If you would like to read this with your ears, click that black triangle up there for the audio version. Thanks.

Hi.
Welcome to Fifty Trades in Fifty Weeks, Volume 1, Number 1. Thank you for signing up! This first edition is guaranteed to be a collector’s item in twenty years, so keep it in good condition and make sure your Mom doesn’t throw it out.
50in50 will use the case method to go through one real-time trade in detail, about once per week. This Substack is targeted at traders with 0 to 5 years of experience, but I hope that pros will find it valuable too. For a full description of what this is (and who I am), see here.
I will try to find the right balance and make your experience educational but also fun. This thing can’t be 5,000 words every time or it will get boring and I will die of carpal tunnel syndrome. Therefore, each week I will pick one or two areas of focus and drill into those while covering the other aspects of the trade in less detail. I have 25 years of trading information in my head and I need to communicate it at the right pace. Let me know how I’m doing so I can course-correct as necessary.
Over the course of fifty weeks, you will get a detailed analysis of every facet of:
How I come up with trade ideas. For example: Narrative, events and catalysts, correlation and fair value, technical analysis, quantitative drill-downs, and hypothesis testing…
Trade structuring and risk management
Filtering good ideas from bad
Alternative hypotheses, pre-and post-mortems
Tactics, execution, position sizing
Psychology
Performance analysis
But I can’t do all that every week! Also, I’m going to try to explain stuff in a reasonable amount of detail because the target audience is newish traders, but I don’t want it to be boring! I gotta lotta needles to thread here.
I am going to limit each post to a maximum of 3,000 words (12-minute read) so that there are some constraints and I don’t drive you mad with 20-pagers every week. If necessary, I’ll throw bonus materials in an appendix or glossary at the end.
OK, that’s the preamble. Let’s roll.
Trade Number 1: Short XAUEUR
XAU is the symbol for gold, EUR is the euro. Normally, when you buy or sell XAU, you are implicitly doing so against the USD, but you can trade gold against any currency you want, depending on your view. Currently, I like the EUR better than the USD so I’m using that as my denominator. This will make all the explanations a little more complicated than a simple XAUUSD trade, but I want to be true to my real views. I prefer not to dumb things down too much.
Before I get into the reasons I like gold lower against the euro, I need to introduce my basic framework. Much of this is explained more deeply in my book Alpha Trader but you don’t need to read that book to understand this blog. I will walk through each step over the coming weeks. And if you did read Alpha Trader, you’re like the kid that read the textbook during the summer, before school started. Winning.
Here is my framework from start to finish. You can grab a PDF of it here. Or the Microsoft Excel version here.


I encourage you to fill one of these out each time you do a meaningful trade. If you are doing 100s of trades per day, that’s not practical but if you’re doing five or fewer trades per day, you can easily do it.
I like to print this thing out and use a pen. There is something about filling out an actual piece of physical paper that feels more serious and concrete than just clicking and scrolling around in another Excel sheet.
When you write something down, it solidifies. It transforms from abstract into concrete. All the sludge falls away and only the important information is left. When you write something down, you have made a choice to select that particular information as more relevant than the rest. This highlights it for your brain. You signal to your brain “THIS IS IMPORTANT”.
Your brain records it as such.
The pathways and connections developed in your brain are different when you write it down because the encoding process is different. The encoding is stronger, more robust, and information is recalled more easily. If you want a message to stick, write it down.
Where the idea came from
The short gold idea comes as the narrative around global central bank easing has changed dramatically and the European Central Bank (ECB) is taking the lead in pushing global rates higher. This is a surprise! Just a month or so ago, nobody expected anything from the ECB. German 2-year rates were bobbing around down in a -75 to -55 range. Then, last Thursday, they did this:
Germany 2-year yield (hourly back to March 2021)

Why does this matter for gold?
Gold is one of the most difficult markets to understand and predict because it’s not a safe haven and it’s not a risky asset. Instead, it’s a quasi store of value and liquidity barometer that sometimes trades like a risky asset. Another strange feature of gold, compared to most assets, is that it’s negative carry. You pay to own it. Most assets (like many stocks and bonds) generate cash flows and thus have an automatic built-in head start over gold or any negative carry asset.
If you invest $100 in gold and $100 in bonds at the current US 10-year yield (1.95%) and both assets go nowhere for 10 years, here’s what your $100 looks like:
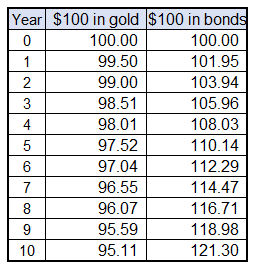
The power of positive and negative compounding means that any investment that produces cash flows will always start with a huge advantage over one that does not. That said, when gold rallied from $400 to $1800 from 2002 to 2011, nobody was worried about the negative carry!
An interesting thing happens, though, when interest rates fall toward, or below zero. Gold becomes much more attractive. If bonds are yielding below zero, gold’s negative carry suddenly doesn’t matter. And bonds with a negative yield are extremely unattractive given their negative carry AND their extreme valuation. Holders of negative-yielding bonds are very unlikely to make money (negative yield = very expensive bond because lower yields = higher price in bond land[1]). Sure gold has negative carry, but if your timing is good, you can make money on price appreciation.
As the quantity of negative-yielding bonds in the world increased from 2013 to 2021, gold became a better and better substitute as you can see here:
Gold vs. % of global bonds with negative yields (2013 to August 2021)
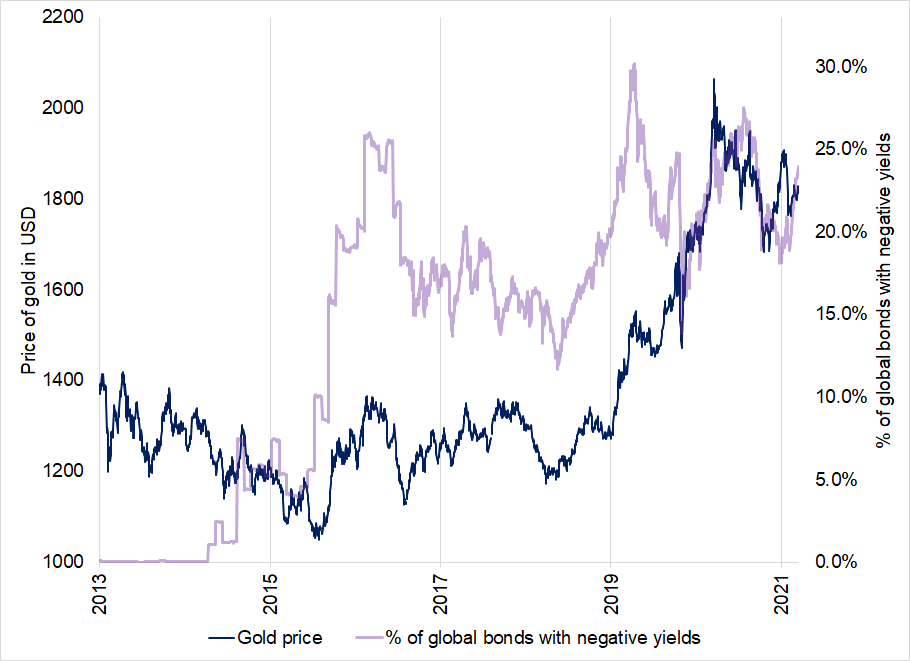
Denmark, Sweden, Switzerland, and other European countries started to experiment with negative rates in 2013 and they remained right through mid-2021. You can see in mid-2015, the percentage of negative-yielding bonds skyrocketed as the ECB announced QE and then Japan cut its benchmark interest rate below zero in early 2016.
You can also see that the more negative-yielding bonds were out there, the higher gold rallied. The ratio in these sorts of relationships is not 1:1. There is noise and leads and lags, but ultralow rates were almost certainly an important driver of higher gold in that period.
Let me show you what the chart looks like now.
Gold vs. % of global bonds with negative yields (2013 to now)

Wow! The “buy gold because central banks are crazy” narrative is stale. We are back to 2015 levels in negative-yielding bonds as rates rip higher. There are plenty of positive-yielding substitutes for gold again.
Another way of looking at this is to examine US real rates (market pricing of US yields, minus inflation) against gold. If real rates are falling and negative, that generally means that central banks are enacting extremely loose policy. Here is US 10-year real interest rates against gold.
Gold vs. US 10-year real interest rates

The signal from this chart is less dramatic, but also confirms that the direction of US real rates is probably bearish gold, not bullish. Some will argue that US real rates are still negative and thus gold is still OK but I generally believe that as traders, you should always focus on changes, not levels. The direction and momentum of US rates and US real rates is higher and that is generally bad for gold.
Global central banks just embarked on the greatest monetary and fiscal policy experiment in history and now that experiment is over. Normalization has begun. The biggest beneficiaries of loose policy are falling one by one. First it was ARKK, then crypto, then the NASDAQ. Next should be gold.
Let’s take a quick pause here to talk about correlation trading. So far I have used various other markets like negative bond yields and US real interest rates to make a guesstimate of which direction gold might go next. This is similar to the way you can piece together what might happen next in the real world by pulling together a series of clues.
If you see clouds in the sky, hear thunder in the distance, and see an umbrella seller dude setting up outside the entrance to the subway, you can make a high probability guesstimate that it’s going to rain soon. But… It might not! It’s not that obvious in markets of course. The clues are much more confusing and ambiguous. As my first boss used to say:
“If trading was easy, it wouldn’t pay so well, would it Burl?”[2]
So my initial thesis here is: The market has been buying gold for the past three years as a reaction to negative yields around the world and falling real rates in the USA. Now, real rates have turned higher, most debt is positive yield again and yet the price of gold has barely adjusted. Markets operate with leads and lags and this type of trade is sometimes called “lead/lag” or “cross-market” trading. You get clues from other markets and you determine that one of these things is not like the other. One of these things does not belong.
Now let’s fill in page 1 of the “Trader Framework and Checklist.”

That is the story of why I like this trade. Now let’s quickly look at some filters.
Positioning
Here is how I look at positioning.

Currently, the market is long gold, and reducing, which is bearish. Here is a chart of the price of gold against CFTC speculative gold positions.
Gold price vs. CFTC positioning

Events and catalysts
Last week’s ECB was the appetizer and the March 10th ECB meeting could be the main course. When the market anticipates an upcoming event, it will tend to position in the direction of least regret. In this case, I would bet the market wants to position for a hawkish ECB meeting on March 10th as that is the direction that has been telegraphed by the central bank and it’s the direction that “makes sense” macro-wise with inflation very high in the eurozone and the ECB abandoning its old dovish guidance. Given the massive move in European rates last week, the market will not want to be caught out in the same direction again.
Technical analysis
Gold has been tracing out a massive triangle formation. Triangles are symptomatic of a loss of interest as volatility falls and ranges contract more and more. Most traders view a break of a triangle as a “go with” and a potential signal that volatility is back and a large directional move is in play. Here is the chart of XAUEUR
XAUEUR daily back to 2017

What is the alternative hypothesis?
Gold bulls say that gold has weathered rate hikes very well. This is true, but markets do not always move instantaneously toward equilibrium. There can be slow-moving, non-price-sensitive flows that keep price from adjusting to new information. If markets were always right, it would be impossible to make money. Markets are usually wise, but not always.
Now let’s complete page 2 of the trader framework.

The trade is most simply executed through spot; no need to get fancy with options or anything. We could do XAUUSD but have decided to be long EUR against gold instead of USD because the ECB is acting very aggressively and is near the start of the hiking cycle, while the Fed pivoted last November and expectations for US rate hikes are high. XAUUSD and XAUEUR are mostly the same trade most of the time, but occasionally you are happy you chose the right denominator. Here is XAUUSD and XAUEUR.
XAUEUR (black) vs. XAUUSD (blue) since 2009

On TradingView, XAUEUR is here.
It takes a big move in EURUSD to make a difference here because XAU is much more volatile than EUR or USD and as such the metal drives the movements more than the currency rate. You can see in 2015, when EURUSD was cratering from 1.40 to 1.10, there was a big divergence between XAUUSD and XAUEUR but generally, it doesn’t usually matter which one you pick. In this case, it might matter and it’s worth thinking about because I am bullish EUR and bearish USD right now for various reasons covered in am/FX (my daily macro note).
The stop loss is 1702 (well through the top of the triangle and above all but the all-time high). I was tempted to put my stop loss ABOVE the all-time high, but I think if the triangle breaks, the idea is wrong, so there is no point tacking on another 50 EUR of P&L risk. My target is the Q1 2021 low at 1410 so I put my TP at 1421 (just ahead of that major support). My other reassessment trigger (other than stop loss and take profit) is that I want to exit the trade before the ECB meeting on March 10.
I have three levels of conviction in trading, TYPE I, II and III. I will explain those in a future 50in50, but this trade I’m going with TYPE II which is where about 60%-70% of my trades end up. I’m risking 2.5% of capital and for this Substack, I’m going to assume $100,000 of free capital. Free capital is the amount of money you can afford to lose. So if you’re at a hedge fund, your free capital is your stop loss. If you’re retail, it’s your account size. 2.5% of capital is reasonable but fairly conservative for an account this size.
Knowing where my stop is and how much money I want to risk ($2,500, or 2.5% of $100,000), I calculate my position size.
My P&L on XAUEUR will be in euros because all currency trades have P&L in the denominator currency. ($2500 / 1.1420 EURUSD exchange rate) means I am risking 2189 EUR.
% risk = entry point minus stop loss / (entry point)
= (1600 – 1705) / 1600
= 6.6%
Note: I added 3 EUR onto my stop loss for estimated slippage.
Position size = EUR at risk / risk%
= 2189 / 6.6%
= 33000 EUR
So we’re gonna sell 33000 EUR worth of gold. If it goes to our stop, we lose $2,500. If it goes to our take profit we make 11.2% or 3692 EUR = $4,230. Risk/reward of about 1.7:1. If this sounds complicated, don’t worry, it just takes a bit of practice.
You determine how many USD you want to risk on the trade, say $X. Then, you figure out what position size will lose you $X based on the stop loss level you determined beforehand using technical analysis or whatever methodology. That’s it. In the appendix, I have presented two more position sizing walkthroughs, in case you would like a bit more.
Once you have the position size, log in to your system, set the notional to 33000 EUR and sell the gold. Boom. If you can’t trade XAUEUR on whatever platform you use, simply sell gold and buy EURUSD (in the same USD notional) and voila! You have XAUEUR.
I would also write down a few feelings at this point like “I’m extra nervous on this one because it’s the first trade of the 50in50 series and I will look stupid if I’m wrong” or something like that.
Conclusion
50in50 goes short XAUEUR at 1600. Stop loss 1702. Take profit 1421.
I will monitor the performance and offer detailed updates as we progress.
That’s it! Please feel free to drop comments below the post if you have any questions or feedback. Let me know what’s working here and what is not so I can make this 1% better each time and by the end, it will be 1.01^49 = 1.62X better than where it started.
Thanks for reading.
My global macro daily is here
My crypto substack is here
And this is my Twitter
DISCLAIMER: Nothing in “50 Trades in 50 Weeks” is investment advice. Do your own research and consult your personal financial advisor. I’m putting out free thoughts for people that want to learn. This is an educational Substack. Trade your own view!
APPENDIX: Extra position sizing exercises
One of the most common questions I get from new traders is: How do you size your positions? For me, the answer is pretty simple. Here are the five steps:
1. You have a trade idea. Let’s say you think bonds are going to sell off in the days leading up to non-farm payrolls (aka The US Jobs Report) because the market is massively long, everyone has been super bullish for months and the whisper number for the jobs number is creeping higher and higher in recent days. This is a classic run-up trade as described in the previous chapter. You have decided the best way to trade this is to buy TBT, the ultrashort bond ETF. While TBT is not a good way to short the bond market for more than a day or two, your time horizon is just two days so you have decided this will be the easiest, most liquid, and levered way to execute the trade.
2. Determine your conviction level. You think this is a classic run-up trade and you love a good run-up trade. You decide this is a Type II trade, which this month means $250,000 of risk would normally be allocated to this idea.
3. Decide how much to risk. You are up $1.0 million this year and have a particularly strong feeling about this trade. The chart set up is great, too, so you can take a big position. Since you plan to cover the trade BEFORE the non-farm payrolls release, you don’t have to worry about gap risk through the number. You decide to risk the standard $250,000, plus 10% of your YTD P&L ($1 million X 10% = $100,000) so you are risking $350,000 on the trade.
4. Determine the stop loss. Use technical analysis and other inputs (average daily range, expected volatility, an understanding of round number bias, etc.) to determine the stop loss on the trade. You have a rule that you always place your stop loss at least one average day’s range away from your entry point. This is a good rule of thumb for new traders. If I know absolutely nothing about a security, the first thing I do when looking to put in a stop loss is calculate the security’s average daily range. Any stop loss closer than 1-day’s range away is at high risk of getting dinged by short-term noise.
5. Determine the position size. To make the math easy, let’s say TBT is trading at $100.00 and you have determined, after looking at the charts and studying the volatility of TBT, that the appropriate stop loss is $102.02. Liquidity is excellent and slippage is not an issue. You estimate 3 cents of slippage on your stop. So you are risking $2.05 / share and you decided in step 3 to risk $350,000. Here is how you calculate the correct sizing:
Position size
= $ at risk / (entry point - stop loss level)
= $350,000 / (102.05 - 100.00)
= 170,731
Therefore, the trader in this example should buy 170,731 shares of TBT. The formula for determining position size is always the same:
position size = $ at risk / (entry point - stop loss level)
Let’s do one more just to make sure it’s clear.
I am a retail trader and I want to sell AUDUSD because: reasons. The currency pair is trading at 0.7500 right now and after studying the pair’s volatility and doing 20 minutes of technical analysis, I have determined that 0.7572 is the correct stop loss. My trading account balance is currently $165,000 and I always risk 2% of capital on every trade. I never run more than one trade at a time so this is a safe way to run my account. I will add 3 pips to my stop loss level to allow for slippage on execution.
2% of 165,000 is $3,300.
Position size
= $ at risk / (entry point - stop loss level)
= $3,300 / (0.7500 - 0.7575)
= $3,300 / -0.0075
= - 440,000
So our short position in AUDUSD should be 440,000 AUD. If we get stopped out, we will lose $3,300, which is 2% of capital.
Bad traders work in the opposite direction. They say: I’m short 2 million AUDUSD at 0.7500 but I can’t afford to lose more than $10,000 so my stop loss will be 0.7550. This makes no sense because 0.7550 is a totally arbitrary level that does not take market factors like volatility or technical analysis into consideration. Always start with $ at risk, then determine your stop loss by analyzing the market. The position size is the output, not the input.
To summarize the five steps explained above:
1. You have a trade idea.
2. Determine your conviction level (TYPE I, II or III).
3. Decide how much to risk. This amount to risk can be in USD or in basis points, depending on where you work. This amount is determined by your conviction level, YTD P&L, and your risk management system.
4. Determine your stop loss using technical analysis and other inputs.
5. Do the math to back out the correct position size.
Using this methodology, your position size can vary substantially. A low conviction position with a wide stop loss for a good hedge fund trade might be 20 million AUDUSD while a high conviction trade with a tighter stop loss for the same trader could be 200 million AUDUSD.
Good traders vary bet size.
Good traders vary bet size.
Good traders vary bet size.
[1] If you don’t have a good handle on how bonds work… Here you go: https://europe.pimco.com/en-eu/resources/education/everything-you-need-to-know-about-bonds
[2] He claimed I looked like Burl Ives because of my ginger goatee.


Share this post