


Hi.
Welcome to Fifty Trades in Fifty Weeks!
This is Trade 3: Short Doximity (DOCS)
Thank you for signing up!
50in50 uses the case study method to go through one real-time trade in detail, about once per week. This Substack is targeted at traders with 0 to 5 years of experience, but I hope that pros will find it valuable too. For a full description of what this is (and who I am), see here.
Click the play button above to read this idea with your ears.
Or… Open in browser
Update: Open Trades
The XAUEUR trade continues to suck wind as Russia risk hangs over markets like the Sword of Damocles.
Side note: The story of the Sword of Damocles is more interesting than I expected it to be. Many lessons.
As explained last week, I strongly prefer to stick to the plan on trades like this; so that’s what I’ll do.
The short oil trade is flat; nothing significant to report there, really. The entry point in April crude was $92.20 and the current level is $92.34. For record-keeping and tracking, I will always use the market price when I hit send on the trade idea. This might differ slightly from the write-up because it takes me a while to write these things.
Update complete. This week, my focus is on technical analysis.
Intro to technical analysis
A good intro to technical analysis (aka, techs) could fill 30 pages but today I’m going to boil it down to 1,500 words or so. If you want to learn more about technical analysis, my three favorite books on the topic are:
John Murphy: Technical Analysis of the Futures Markets
Dalton, Jones and Dalton: Mind Over Markets
Steve Nison: Japanese Candlestick Charting Techniques
Also, both my books have extensive sections on technical analysis. Pages 107 to 178 of The Art of Currency Trading and Chapter 10 of Alpha Trader are all about techs.
What is technical analysis?
Technical analysis is the study of chart patterns in an attempt to forecast future price movements. The theory is that in a natural system composed of many human beings, price patterns will repeat and echo as humans tend to behave in similar and predictable ways over time. This psychological regularity should generate patterns that can be seen in real-time and used as predictors of future market moves.
There are literally hundreds of technical patterns ranging from generic (support and resistance levels) to very esoteric patterns like the “Abandoned Baby” or the “Three Buddha Bottom”. Anything involving charts and pattern recognition usually falls under the heading of technical analysis.
Does technical analysis work?
There is a ton of research on technical analysis out there, but unfortunately no conclusive evidence. There is some modest evidence of persistent trend and tradable patterns in certain markets over time, but it is unclear how much of this works in real-time (it could just be hindsight and data snooping). Trend following models in FX have performed poorly since the 1990s and the evidence generally suggests that some patterns worked for some periods but profitable technical patterns are arbitraged away over time.
Some people think technical analysis is useless—a complete joke. Other traders think technical analysis is the only tool you need to trade successfully. My philosophy on technical analysis is somewhere in the middle.
I think technical analysis is a valuable tool but does not work well as a standalone trade selection or forecasting methodology. The more years I trade, the more strongly I believe that technical analysis should be used as a tactical and risk management tool and not as a trade selection tool. This comes from years of trading experience, from watching many people trade, and from reading volumes of research on the topic.
While there are examples out there of successful purely technical traders, in more than 20 years of trading on both the buy side and the sell side, I have never worked with a purely technical trader who made real money. Every successful trader I have worked with over the years either trades macro or uses a multifactor approach. And I have seen many traders who use only technical analysis fail miserably.
A majority of the most successful traders of all time: Soros, Tudor-Jones, Bacon, Druckenmiller, etc… Are macro or hybrid guys, not pure technicians. They supplement their analysis with charts but their ideas come from all over the place. Again, I’m not saying it’s impossible to trade purely techs, but success rates are microscopic.
Do you really think it passes the common-sense sniff test that you can just look at a chart, see a simple pattern, trade it, and consistently make money? Given the thousands of traders and billions of lines of code, you are competing with… Probably not. There were systematic funds that profited from simple technical analysis in the 1980s and 1990s but those days are long gone. Systematic funds now compete on a much more complex playing field and the profitability of simple trend following and other technical systems has converged towards zero.
There is a simple reason that using technical analysis is inherently risky for humans: Humans are designed to see patterns. It’s how our biology works. It allows us to simplify and process a complex world. This human tendency to perceive meaningful patterns within random data is called “apophenia”.
For example, this faucet which looks nothing at all like a face:

The human brain is designed to see patterns! Even where they do not exist.
If you are bullish some security, I can guarantee that if you look at a chart long enough you will find a pattern that confirms your bullish view. In other words, another problem with technical analysis is that it is subject to confirmation bias. You see what you want to see. A friend of mine once said “Charts are like clouds. If you stare long enough, you will eventually see something interesting!”
Furthermore, most of the empirical evidence from research shows that if you trade popular technical patterns like Head and Shoulders systematically, you do not make money. So I strongly believe that technical analysis is best used for risk management and tactical considerations and not as a primary trade selection tool.
While my belief is that the value of technical analysis as a forecasting tool is limited, I use technical analysis every day. I come up with my trade ideas elsewhere and then go to the technicals to determine optimal tactics such as entry level, stop loss, take profit, and position size.
Without technical analysis skills, you are too often entering trades at midrange with no clear concept of where to get out. Techs give you clear-cut risk management levels and allow you to maximize your leverage and determine the point at which you will admit you are wrong. Note that my approach also meshes with research that shows that portfolio managers who use technical analysis outperform those who do not[2].
I strongly advise you to learn about technical analysis—but consider it a risk management and tactical tool, not a trade selection or forecasting tool. Never do a trade just because a chart looks good or because something is on a big support or Fibonacci level.
From personal experience, observation of 100s of other traders over 25 years, and reading the research… I believe:
Technical analysis is an important part of almost every excellent trader’s toolkit.
Technical analysis is overrated and overused, especially by new traders.
Think of technical indicators the way you think of the rearview mirror and dashboard indicators in your car. They tell you where you have been, how fast you are going, when you might run out of gas, and so on. But they don’t tell you where you are going. For that, you need to piece all the indicators together, then look out the front window.
Technical indicators that I like
When it comes to technical indicators, here’s what I like and why.
I like: Simple and objective
The more complicated something is, the less I like it because subjective and complicated approaches tend to be time-consuming and poisoned by confirmation bias.
If an Elliott Wave practitioner is subconsciously bullish NASDAQ because of her secret crush on Cathie Wood, she will always be able to find a bullish wave count.
Permabears with expert knowledge of Elliott Wave can always find a bearish count.
In contrast, if your system is (for example) “don’t be long anything that is trading below the 50-day moving average”… It doesn’t matter what your bias is because your system is simple and objective.
Also, the self-fulfilling prophecy aspect of technical analysis works best with simple approaches. Part of the reason a level might hold is that everyone believes it will hold—and so everyone puts their bids there. If you are using PhD quantum physics and homological mirror symmetry to find your tech levels, and nobody else in the known universe is, the levels you find just might not mean much in the market.
Open-ended approaches that are not objective can yield way too much noise. For example, traders like to use Fibonacci levels as support and resistance. I don’t mind a bit of numerology and there is an appealing concept behind Fibonacci (or fibo) levels: When something drops a lot, you wait for a big bounce to sell it. That, in itself has some value. Instead of chasing something lower, practitioners of Fibonacci retracements will wait for a bounce of 61.8% or 76.4% of the down move and sell there. This can be good!
On the other hand, here is a EURUSD daily chart marked with all the daily fibos. Separating noise from signal can be difficult. If you’re bullish on the way down, you can always find another fibo to justify it.

I like: Approaches that reveal an underlying reality in the market
Some technical setups directly reveal a reality in the market. Horizontal lines could reflect large orders out there. Slingshot reversals can reflect a final capitulation of speculators through a key level. Gaps can reflect where the liquidity is (or isn’t). Let’s take a look at a few ways techs can reveal underlying market reality.
Horizontal lines
Most of the technical approaches that I use reflect something about the underlying structure of the market in a particular area. For example, the beauty of simple horizontal lines is that they very often reflect the presence of large orders. Let’s say a Japanese auto exporter needs to sell 5 billion USDJPY, and they have left an order with a bank to sell at 116.33. They are patient and don’t mind waiting. You might get a chart that looks like this:
USDJPY double touch of horizontal resistance at 116.33

There’s very often a reason horizontal lines work: They are reflecting the reality of large bids and offers in the market. Remember that because support and resistance are simple and not subject to much interpretation, most people in the market will be monitoring roughly the same support and resistance levels.
Therefore, you need to think about the metagame and leave your stops far enough below support (or above resistance) that you are not dinged by a weak stop loss run that takes out an obvious level. It is often best to place your stop loss about a half-day’s range below a major level to avoid any noisy whipsaws around that point.
2. Volume spikes
Another approach that I like is to look for volume spikes at price extremes.
High volumes reinforce the importance of a support or resistance level or can signal that it has been decisively broken. High volumes provide signal confirmation for technical patterns.
The next chart shows a massive volume spike at a turning point. Note the huge volume as EURNOK made a low in late August 2021. That marked the ding dong low in the pair. If you squint, you can also see the second-largest volume bar coincides with an important low in mid-June.
Volume spikes at a price extreme are super useful indicators that huge volume has gone through and the move was rejected or accepted by the market.
EURNOK hourly, April 2020 to September 2020

3. Moving averages
One of the easiest ways to make sure you are not fighting the market is to implement a simple moving average (MA) rule. For example: I will only be long if the market is above the 50-day moving average. I will only be short if the market is below the 200-hour moving average. And so on.
I have a 200-hour moving average on all my charts because that matches my time horizon, but it’s kind of arbitrary. You can backtest and find the best fit for trend and that’s a good starting point just don’t forget that out of sample, the best fit will probably not be the exact MA you found in your backtest. The idea with MA’s is not to seek the false precision of an exact lookback period, it’s to find a moving average that roughly matches the ebbs and flows of your market so you don’t get a million noisy signals every day, but you also don’t get one or two signals/year.
One hedge fund that I know uses a very simple rule which I like. They are bigger picture than me, so they use a 100-day MA filter, and then they simply apply that to all their macro views. They have a bunch of analysts and portfolio managers who come up with all the discretionary views but they only execute those views which are on the correct side of the 100-day MA.
This avoids the problem of: “I loved it at 10, now it’s at 7… So I must really love it now!” A rigorous approach to technical analysis leads to good risk management and tells you “You’re wrong, it’s time to get out.” Very often, fundamental analysis will never tell you to get out and might tell you to keep doubling down as prices get more and more attractive. You see this in crypto a lot.
Alright, that’s the background material for today’s trade idea.
To be clear: I never do a trade purely on technicals. Technicals are a good risk management tool but not a great forecasting tool. My ideas come from my read on changing narratives, from cross-market correlation, pattern recognition, backtesting, positioning, and other fundamental or microstructure analysis. Then, I use technical analysis to hone my tactics, maximize leverage, put up risk management guard rails, and determine the stop loss and take profit. Sometimes, I’ll find a trade I love and then the techs don’t line up, so I’ll wait. Strategy vs. tactics.
And now, a quick word from our sponsor.
Today’s 50in50 is sponsored by Spectra Markets and am/FX.
Accelerate your learning! Get Brent Donnelly’s daily notes on global macro (including live trade ideas) in your inbox, every single day. You will also get occasional creative brilliance, dumb facts, huge Excel grids, and video game/book recommendations. Brent Donnelly calling himself Brent Donnelly. Gotta love it.
Subscribe to am/FX here
Trade 3: Short DOCS
I will run through the narrative explanation for this trade very quickly as the focus this week is on technicals. Please don’t email me what a great company DOCS is, or how telehealth is the future. I’m sure it is!
My view here is short-term (2-4 week time horizon) and anyway… Great companies can make terrible investments. When I was screaming about Zoom and Shopify being terrible investments last year, Twitter would fire back with cringe replies like:
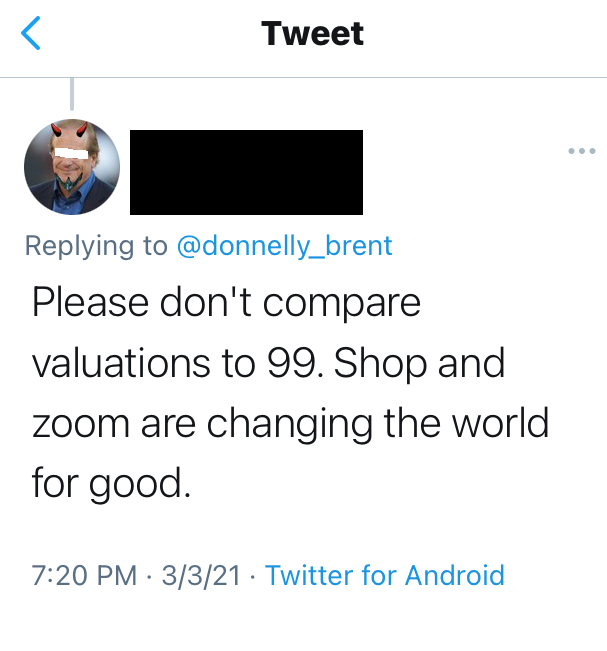
In the midst of heavily hyped narratives, people forget that stock investments are a combination of: a) How good is the company, and b) what are you paying for it?
A BMW M5 is a great car, but not good value at $1,800,000.

ZM and SHOP can be great companies and wildly overvalued at the same time. If you want to read more about this, I had a conversation with Howard Marks on this topic in March 2021. You can read it here.
Regardless, this is a short-term trade. The market is punishing high-priced stocks and I expect that to continue. Babies out with bathwater.
My thesis is:
All COVID darlings getting taken to the woodshed one by one
Teladoc, DOCS main competitor, crashing to new lows
Market is dumping expensive stocks. DOCS trades at 35x sales, making it the 15th most-expensive US-listed large cap. I like price-to-sales as a simple valuation metric because earnings are much easier to manipulate/obfuscate than sales. It’s not perfect; it’s a simple heuristic. If you’re curious, the average stock in the US trades around 1.5X sales. And this link will show you the highest price-to-sales ratios for large caps.
Big spike on earnings offers a better entry point for shorts compared to most COVID favorites which are mostly down 50% to 80% at this point. Telehealth is one of the sexy narratives around COVID and while I’m certain it’s a massive trend in health care, the stocks of highly-valued megatrend disruptors are under severe pressure and are likely to remain under severe pressure. ARKK’s price performance has shown (just like 1999 showed)… Great companies can be terrible investments, especially in the short and medium run.
Massive volume spike high rejected on good news (earnings). I will discuss this below.
Strong horizontal line resistance at $58/$60 over the past two weeks
Target the bottom of the huge gap ($50) and the 200-hour MA at $49.10.
Let me be crystal clear here: I am not a stock analyst. I look at narratives, short-term indicators, microstructure, and other factors to make trading decisions. I don’t know who the CEO of DOCS is and for the purposes of this trade, I don’t care. Big picture fundamentals are irrelevant on a 2-4 week time horizon.
Trading and investing are completely different sports.
Also please note: This is an educational blog. Don’t copy my trades. Learn from my process and develop your own trading style that has edge. Thanks.
Explaining the tech setup
Take a look at the hourly chart below. You can see that there was a massive volume spike in November and that marked the absolute high. Now, we have another massive volume spike high at $65 on the earnings announcement (plus DOCS buying Amion). Everyone that wanted to buy on the earnings release has done so and is almost surely trapped out of the money having bought $60/$62ish.
DOCS common equity hourly chart with 200-hour MA in blue

If we zoom in a bit, and look at 5-minute chart, we see two important bits of info. There is a second volume surge when DOCS broke back down below $60 (this is the weakest of the headline buyers stopping out, where price breaks below the black line 10/11FEB) and we now have nice horizontal resistance at $60. This persistent distribution near $60 is probably a major institutional investor trying to reduce or exit a large stake.
DOCS common equity 5-minute chart with horizontal resistance

This gives us a nice setup where we can go short here and put a stop loss at $60.51 (above the horizontal line with a bit of room for noise). The take profit is $50.21 as we want to be in front of both the bottom of the huge news gap, and the 200-hour MA at $49.20. Based on Friday’s close ($57) that would be risking $3.50 to make $6.80 for a gain of about 2x the loss.
See the completed framework here for all the nitty-gritty details. I will use the NYSE open on 22FEB22 for the entry point (for tracking purposes) since I’m sending this on a holiday Monday in the USA. My trade is to sell $56 or better because selling worse than $56 just messes up the risk/reward too much. If DOCS opens below $56, this becomes a limit order to sell at $56.
Conclusion
50in50 goes short DOCS at the open 22FEB @ $56 or better. Stop loss $60.51. Take profit at $50.21.
Risking $2,000 this week, or 2% of capital. Therefore, short 443 shares ($2,000 divided by $4.51 per share of risk = 443 shares.) As is the case with most stock trades, there is gap risk here if DOCS releases news overnight.
That’s it for today. As always, I will monitor the performance and offer detailed updates as we progress. See you next week!
Thanks for reading.
Trade at your own risk. Be smart. Have fun. Call your mom.
My global macro daily is here
My crypto substack is here
And this is my Twitter
DISCLAIMER: Nothing in “50 Trades in 50 Weeks” is investment advice. Do your own research and consult your personal financial advisor. I’m putting out free thoughts for people that want to learn. This is an educational Substack. Trade your own view!
Endnotes
[1] https://en.wikipedia.org/wiki/Apophenia
[2]Head and Shoulders Above the Rest: The Performance of Institutional Portfolio Managers Who Use Technical Analysis


