


Hi.
Welcome to Fifty Trades in Fifty Weeks!
This is Trade 5: Add moar bitcoin
Thank you for signing up!
50in50 uses the case study method to go through one real-time trade in detail, about once per week. This Substack is targeted at traders with 0 to 5 years of experience, but I hope that pros will find it valuable too. For a full description of what this is (and who I am), see here.
Click the play button above to read this idea with your ears.
Or… Open in browser
Update: Open Trades
The first three trades are stopped out and BTC is around 4k in the money. Not a great start to this process but that’s trading. The odds of the first three trades getting stopped out are about 12.5% so it’s disappointing but nothing to make me question whether or not this is a bad idea. Even if it is… I’m doing this for 50 weeks no matter what! Again, I like to provide updates for transparency but the idea here is to teach the process and not worry about the outcome.
Update complete! This week, my focus is on P&L variance and market volatility.
Fooled by randomness
Traders who do not understand randomness and variance overestimate the importance of skill in the short run and will react more emotionally to the ups and downs of their P&L. Some days, you’re going to get lucky. Some days you will be unlucky. And in the long run, we are all dead. But somewhere in the middle of those two time horizons is the place where trading results are signal, not noise.
The starting point to understanding signal vs. noise in markets and in your P&L is a basic understanding of statistics. If you don’t have much of a math background and don’t know much about statistics, take an intro to stats course or read “How to Lie with Statistics” or “Naked Statistics.” You need to know the primary statistical analysis topics like standard deviation, mean vs. median, variance, volatility, and expected value.
Why variance matters
Your P&L is going to go up and down and you won’t always know why. Unlike poker or other forms of skill-based gambling, the odds in trading are not static or defined. You are constantly estimating odds of success in a game you don’t ever fully understand or know you can win. Here are some examples of negative variance outside trading:
Example 1: You are playing poker. You have two aces and your opponent has a junk hand like 9-5. The player with 9-5 is drunk and goes all in and you obviously call. The flop is 9-9-5 and you lose to the full house.
Example 2: A tennis player hits a perfect shot down the line and the umpire calls it out, even though it was clearly on the line.
Example 3: A baseball player hits a line drive that looks like a clear home run but the opposing center fielder climbs the wall and grabs it for a very loud out.
A professional poker, tennis, or baseball player in these situations will tend to understand that they did everything they were supposed to do and ran into a very unfortunate bit of bad short-term luck. They understand that if you re-run the same event 1,000,000 times, the result would be a success more than 99% of the time. They can shrug it off and understand that their process was good and while the outcome clearly stunk, they have nothing to feel bad about.
On the other hand, a weak player or someone who does not understand process vs. outcome or what they control vs. what they do not control will be enraged. “I can’t believe that guy flopped a full house! I am the unluckiest person in the world!” etc. That is what Annie Duke calls “resulting”. When you focus on results, you fail to understand what you control and what you do not control—this is a major fault. In life, trading, sports, and everywhere, you need to understand what you control and what you do not.
What is most important is to make the distinction between those things that we do and do not control. This is captured nicely in the Serenity Prayer, a mantra popularized by Alcoholics Anonymous but relevant to everyone:
God, grant me the serenity to accept the things I cannot change,
courage to change the things I can,
and the wisdom to know the difference.
The last line is key. Think about what parts of the system you control. You control the inputs, not the outputs. In trading, this means focus on good thinking and rational decision-making and don’t get upset when you hit a bad run.
People waste way too much time worrying about random stuff they can’t control. This is often true in trading but it is true out there in the world, too. A big part of my personal philosophy is to not waste time on things I cannot control. For example, when I was younger, I would spend months obsessing about what my bonus was going to be in January. As discussions started in September and expectations management took hold into October and November, I listened to all the speculation about the bonus pool and tried to keep my ear to the ground to get a sense of what my bonus might be.
As years passed, I realized something. If I come into work and try my best and perform well and do a good job… The bonuses take care of themselves. There is no correlation between how much you worry about what your bonus is going to be and how much you get paid. There is, though, a strong correlation between your bonus and: how hard you work, how well you prepare, how disciplined you are, and what kind of attitude you have.
Come in and trade each day with a positive attitude. Do the work. Focus. Behave rationally. Go home. Do it again tomorrow.
That is the 22-word recipe for trading success.
Is it variance… Or do I just suck at this?
P&L variance
The best way to shield yourself from variance (and negative thinking about variance) is: Collect data. The more data you have about your trading, the less frightening it will be when you hit a losing streak. People have a hard time believing that streaks are the result of randomness, even though random data contains many streaks! (See: Clustering illusion).
In statistics and probability, variance is the concept that in a series of numbers with a given average, individual data points will be spread out away from the average. So even if your average daily P&L over the last 10 years is +$23,000, you might still lose $25,000 five days in a row sometimes. This may not mean you did anything wrong. It’s just variance.
Variance is a prominent feature in poker. A well-rested professional poker player will inevitably beat a drunk amateur over a long period, say 12 hours. But over any 10-minute or even 30-minute period, the drunk amateur might prevail. The key to understanding variance is that it is most visible in short samples. The larger the sample, the closer the aggregate data will approach the true average.
Luck is a short-term thing. In the long run, skill prevails.
Then again, as Keynes famously said… “In the long run, we are all dead.” A very solid trading strategy with a significant edge generates substantial variance, even year to year. This is why it is incredibly difficult to evaluate traders, portfolio managers, and hedge funds. Was it luck or was it skill? Michael Mauboussin’s book: The Luck Equation: Untangling Skill and Luck in Business is the go-to book on this topic.
To give you a sense of how variance impacts a year of performance in trading, let’s run a few simulations. For simplicity, we’ll use a static risk management approach where the trader does not change their risk appetite during the year, regardless of performance. That said, I strongly advocate increasing your risk as your P&L rises.
I include these simulations because I think very few people, even expert traders, truly appreciate just how dramatic the impact of variance can be on performance. It is probably a defense mechanism. If we truly appreciated how important variance was, we would feel like we barely control our own fate. And humans love to believe they are in control.
The first simulation approximates the performance of a retail trader. She makes money 50% of days and loses money 50% of days. Her average winning day (net P&L) is +$2,000 and her average losing day is minus $1,200. Based on these figures, she will expect to make $100,800 in an average year. Here is her cumulative YTD P&L simulated 100 times.
Variance simulation for a retail trader
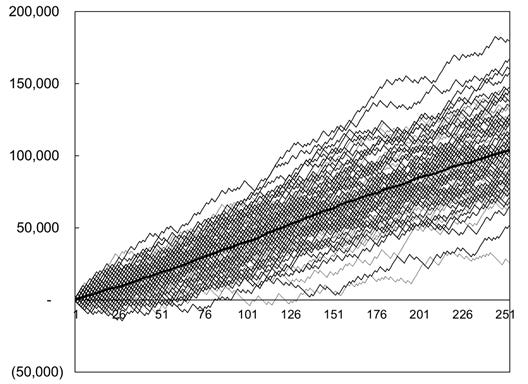
The same trader using the same strategy in a world with the same probabilities might make $50,000 one year and $150,000 the next, with variance—and literally nothing else—to blame.
The second simulation represents a bank trader. He makes money 55% of days and loses money 45% of days. His average winning day (net P&L) is +$150,000 and his average losing day is minus $120,000. Based on these figures, his expected value is +$7.2 million. But here is how he fares in 100 simulations:
Variance simulation for a bank trader

You can see that despite employing a process with substantial edge and positive EV, a trader’s annual performance is all over the place simply due to variance. This is a big reason why it is so flipping difficult for management to properly assess traders and for traders to evaluate themselves. It’s easy to be fooled by randomness!
One of the most difficult and most important skills in trading is the ability to distinguish between variance and bad decision making. If you are losing money right now, is it because your process has broken down, your discipline sucks and the market has completely changed? Or is it because of the inevitable variance within the P&L distribution?
When you are on a bad streak, you need to ask yourself this. The longer you have been trading, the easier this is to answer (usually). For me, I can usually look back on a losing streak and determine with a fair amount of confidence whether it was variance. When you are starting out, it’s almost impossible to tell.
Here are some examples of how I look at a losing streak and determine whether it’s a product of variance or bad process.
Variance
I was wrong a lot. Being wrong is part of trading. It’s OK to be wrong!
I got unlucky. I was long and some bad news came out yesterday. Today, I got stopped out at the highs.
When I am wrong and I lose money, I barely care. That’s trading. As long as I have been sticking to my risk management system, I shrug and move on. Being wrong is where variance comes from in trading. Don’t worry about it. On the other hand, some things can't be attributed to variance.
The first three trades I did all got stopped out on some sort of variance attributable to Russia headlines and news. At some point, you can’t keep exposing yourself to the same randomness and so I am now making an effort to focus on trades that are less likely to get smoked on Russia headlines.
Not Variance
Here are negative outcomes that are NOT explained by variance.
I have been right, and I am reading the market pretty well, but I am losing money. This is a strong indicator that there is something wrong with my process or risk management. For much of 2020, I was in synch with the market and my percentage of accurate calls was very high. But my performance was disappointing because of multiple breakdowns in discipline and process. I was wrong-sizing my trades and bleeding on random, low conviction ideas. If you are reading the market well and losing money, that’s a red flag: something is wrong with your process and it’s not just variance.
I traded with no plan. I walked in each day and started hitting buttons without a good sense of what I was trying to do. I cut out of good ideas early because I was bored.
I keep fading the same news event or trading close to known, potentially random risk events.
I am overtrading. I should be tight/aggressive but instead, I’m making a series of small bets on random, dumb ideas and leaking money every day.
I left a stale order in the system overnight and it triggered a loss. Poor attention to detail is not bad luck.
My discipline is poor. I broke my risk management rules. My positions were way too big. I kept moving my stop lower instead of cutting. I doubled a losing position.
The market regime has changed and I have not adapted.
My boss is giving me a hard time and making me nervous.
If I keep losing money, I am going to lose my job.
I am tired. I am arguing with my spouse or children. I think I might get a divorce. I am drinking too much. I feel depressed. I don’t want to do this anymore.
If losses stem from any of 1 to 9 above; that’s not variance. That is bad trading, bad process, or bad mindset. Cut all your risk and figure out how to get things back on track. When you trust yourself to do the right thing, you are trading well. It should not matter all that much whether you make or lose money on any given day.
When you are trading with a good mindset, you see each trade and each day as a series of independent events with a probabilistic nature and you understand that some trades and some days you will lose money. Each day, you come in and do your best without getting too high or too low. You invest most of your energy in the process and very little in the outcome. Each trade, you go through a thoughtful process and execute in a rational and systematic way.
Get comfortable with variance.
If you understand your edge and can confidently explain it, you will be much more comfortable with variance. Furthermore, if you continually spend time thinking about the current regime and how to adapt to present market conditions, you will reduce your variance and maintain steadier performance over time. No matter how good you are, though, you still need to understand that variance is a thing.
Signal or noise?
Market volatility
Markets are noisy, complex systems. Sometimes they trend; sometimes they chop around; sometimes they go nowhere. People say price is always right, or markets are always right, or “the bond market knows something”… But that’s not always true. Often, markets are just quasi-random distributions that are pushed around by random flows, emotional human outbursts, and forced or non-price-sensitive buying and selling.
One key to understanding your market is to understand how it moves. Before you trade any market, you need a good understanding of volatility. I am not a huge fan of paper trading in general but one benefit of paper trading is that it allows you to watch a market and get in sync with its ebbs and flows so that you understand how it moves. You should watch a market for at least a month or two before you trade it. This will give you a sense not only of general volatility but also of what constitutes a fast market or a quiet market.
Another important way to familiarize yourself with a market is to analyze the market statistically before trading it. Note that volatility and liquidity are not static; they change over time and therefore historical measures of volatility are by definition backward-looking.
Volatility is a statistical measure of how an asset price moves. It uses historical data to analyze the standard deviation of past moves. Assets with higher volatility tend to be riskier by nature. Volatility is usually expressed as an annual percentage. It can also be expressed as a standard deviation or histogram of returns. The higher the number, the more volatile the asset.
The reason that volatility matters is that it relates directly to position sizing. You cannot trade as large a position in an asset that is more volatile, because your risk of ruin is larger. Many experienced traders that I have worked with over the years never fully understood this concept.
For example, many bank traders I worked with simply ran 10 lots all the time. In other words, they would tend to be comfortable long or short 10 million NZDUSD or 10 million EURUSD or 10 million USDMXN, completely disregarding the fact that each of these currency pairs has different volatility and therefore the amount of P&L dollars at risk on each position of 10 million is different. You need to normalize your position size based on volatility. Take smaller positions when volatility is high and larger positions when volatility is low.
Trade 5: Double the BTC position
Let’s go to Trade 5.
I’m doubling the bitcoin long position.
The random volatility triggered by the ongoing conflict in Ukraine has been making a mess of my positions and while bitcoin has historically been a risky asset, it may attract some safe-haven flows as the EU and the US weaponize their financial systems against Russia.
Recent news about the weaponization of the global payments system (along with guilty until proven innocent financial seizures in Canada) has buttressed the idea of a parallel financial system that can at least partially avert arbitrary government freezes and seizures. This should provide a strong short-term tailwind for BTC as money exits EUR and USD and looks for a safe home in a world where there are very few safe homes. I wrote about this in my global macro daily and you can read more here:
28FEB am/FX: New World Order
01MAR am/FX: Where to stash all the cash?
I don’t mind doubling down on a trade like this. I will record and track the trades as two separate line items. Risking 2% of free capital again and the stop is much closer so the position size is 0.5BTC this time (vs. 0.25 last time). The trades are obviously correlated since they are the same product, but the different entry and exit parameters mean they can be treated as two different ideas for the sake of risk management. Obviously, you cannot just keep piling on the same idea but doubling my position from 2% to 4% of capital with two different stop losses isn’t overly insane.
Bitcoin rejected the lower equilibrium zone (34000/41500)
As you can see in the lower box on that chart, the 34000/41500 equilibrium zone has been rejected in favor of the previous, higher equilibrium. As such, we should stay above the 41500 level again as was the case in the second half of January. I will put my stop on this piece at 38900 and the take profit is 51900.
50in50 goes long more BTC. Long at 43500 with a stop at 38900.
Doubling the position with a fairly tight stop as the narrative momentum and price momentum work in favor of the idea—and I try to avoid Russia headline risk after that triggered too much random variance in the first three trades.
That’s it for this week! Check out the completed framework right here.
That’s it for today. As always, I will monitor the performance and offer detailed updates as we progress. See you next week!
Thanks for reading.
Trade at your own risk. Be smart. Have fun. Call your mom.
My global macro daily is here
My crypto substack is here
And this is my Twitter
DISCLAIMER: Nothing in “50 Trades in 50 Weeks” is investment advice. Do your own research and consult your personal financial advisor. I’m putting out free thoughts for people that want to learn. This is an educational Substack. Trade your own view!


