Hi.
Welcome to Fifty Trades in Fifty Weeks!
This is Trade 4: A respite from winter
Long bitcoin for a tactical rebound
Thank you for signing up!
50in50 uses the case study method to go through one real-time trade in detail, about once per week. This Substack is targeted at traders with 0 to 5 years of experience, but I hope that pros will find it valuable too. For a full description of what this is (and who I am), see here.
Click the play button above to read this idea with your ears.
Or… Open in browser
Update: Open Trades
The XAUEUR and oil trades got stopped out on the Russian invasion. This is a bummer, but that’s trading. I was wrong about the Russian risk and thought it was a risk worth selling. There is no shame in being wrong. In fact, if you are ashamed to be wrong, it will be hard to succeed as a trader. The best traders in the world are wrong, all the time.
Sadly, short XAUEUR and short oil both look like amazing trades now so perhaps the lesson is “wait for the climactic news before you try to take the other side of a geopolitical event.” I got in front of a known risk and got run over. Then again, if they never invaded, I would have regretted waiting and Hindsight Harry is the best trader in the world.
DOCS is flying around but going nowhere for now.
Update complete! This week, my focus is on the narrative cycle.
Bullish World
I have been leaning mostly bearish risky assets since last November when Powell dropped “transitory”, the crypto/GameFi/Web3 sentiment bubble was raging out of control and the bulls controlled the narrative cycle.
Now, all the GameFi tokens have crashed, Web3 haters have a voice, crypto is off 50% to 60% from the highs, the Fed is priced for 7 or 8 hikes, Russia has invaded Ukraine, ARKK is back to where it was two years ago, it’s cool to make fun of Cathie Wood on Twitter, and so on.
The narrative and zeitgeist now are a mirror image of where we stood in November. This is all textbook narrative cycle.
What is the narrative cycle?
The narrative is the story the market tells itself to explain movements in price. Like any good story, there is usually the main plot and then a few subplots. The main arc is the most important to understand because markets tend to focus on one thing at a time. But you also need to be ready for the next story as it elbows today’s narrative out of the way.
Understanding narrative is what most people used to call fundamental analysis but there is an important nuance. Narrative analysis is about studying not just what you think is the story, but (more importantly) what story market players are telling and what story the market itself is trying to tell. When it is done well, narrative analysis is a coherent and fluid combination of ever-changing macroeconomic fundamentals and behavioral factors. It is often about nailing down the one, most important story the market wants to trade and then tracking the evolution of that story.
For example, 2010 to 2012 was a remarkable period in FX markets as the market watched the near implosion of the eurozone at the same time as the US Federal Reserve enacted a series of quantitative easing (QE) programs. The eurozone crisis was bearish EUR and US QE was bearish USD. During this period, EURUSD was known as “two garbage trucks colliding” because both currencies had huge issues.
The interesting thing about trading that period, though, was that one story or the other clearly dominated most of the time. The market was either freaking out about the eurozone or going bananas over US QE but it was usually clear which theme was in the driver’s seat. This is typical. It is very difficult for markets to hold two competing themes in its collective hivemind at once, and so the focus oscillates back and forth instead of going in two directions at once.
Understanding the narrative cycle is important because when you are good at it, it is a critical tool that helps you identify turning points and trends. You see the psychology and storytelling at work in the market and you can predict where price is going to go. Surprisingly, the narrative often turns before price because price has momentum of its own and a propensity to overshoot.
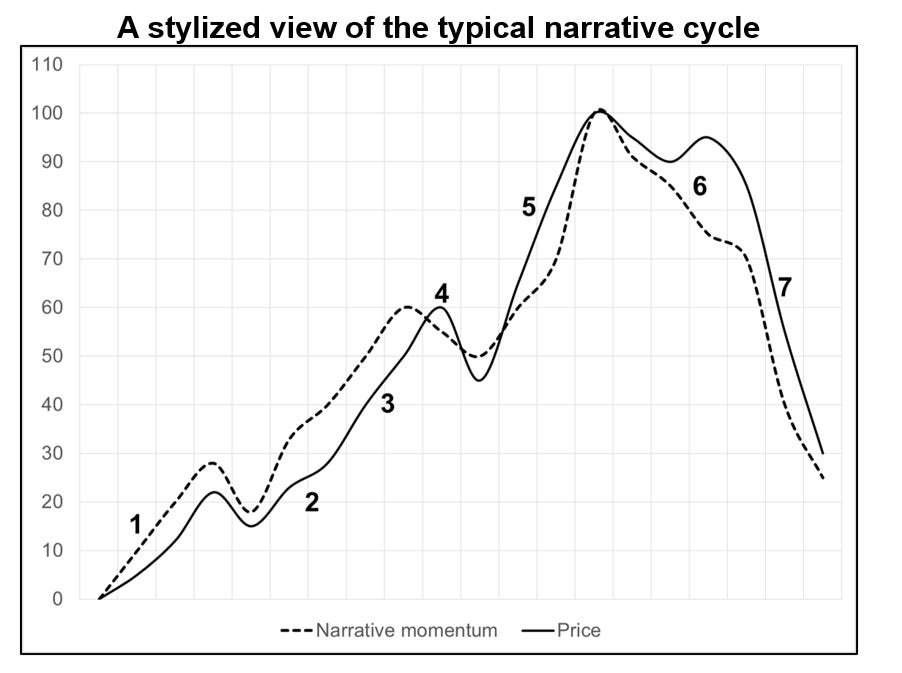
Here is the general narrative cycle:
The numbers on that chart refer to the following section in which I will briefly describe each phase of the narrative cycle. You might recognize this as similar to other cycle analysis like the panic/euphoria model or the famous “SELL? SELL? SELL? BUY! BUY!” comic by Kal. It also rhymes a fair bit with Elliott Wave analysis.
Think about the narrative arc of Cathie Woods’ ARKK ETF as you read this. It fits perfectly.
Stage 1: Under the radar. At this point, there is a new narrative forming, but very few traders have heard about it. Some smart, independent thinkers and research-oriented people are talking about it and a few contrarians are putting on the position.
Stage 2: Momentum Builds. At this point, the narrative goes a bit viral (at least among professionals or experts) and the price jumps to reflect the new zeitgeist. Remember that at every stage of the narrative cycle, there is a dynamic interplay between price and narrative. The story drives the price and the price drives the story and often it is hard to tell which one is causing the movement. For example, say a stock has a good story but it’s still in Stage 1 of the narrative cycle. Nobody is paying attention. A fund manager reads some three-week-old research and decides he loves the story. He starts buying stock and liquidity is poor. The price rallies 4%. Some stale shorts stop out and the fund manager keeps buying and soon the stock is up 11% over the course of two days.
Because the stock rallied, it appears on a few radars (many firms and individuals run scans for stocks with unusual volatility) and this generates some new interest. Traders and investors look it up and some of them like what they see (great story!) and that triggers more buying. In this little description, the price is now feeding the narrative, not the other way around. The narrative already existed three weeks ago.
As momentum builds and the stock hits (for example) a 60-day high, trend followers and CTAs will start to buy. This feedback loop where changes in price influence investor expectations, which influence the narrative, which influences the price, is a form of reflexivity. Reflexivity is a concept from sociology that was transferred over to finance by George Soros. It is a fancier way of saying “circularity” or “feedback loops”.
As momentum buying feeds the narrative and feeds on itself, we enter Stage 3.
Stage 3: The Primary Trend. This phase is where the narrative drumbeat takes hold and there are more and more converts lined up behind the apostles from Stage 1. Pullbacks are bought and the news reinforces the price which reinforces the trend which reinforces the buying. This stage is often the most profitable in a strong narrative because Stage 3 can last a surprisingly long time. Just because a narrative is well-known, that does not mean it’s exhausted.
Stage 3 involves a lot of hype, usually from financial media and tourists who have joined the party fairly early. Again, just because there is hype, don’t think the story is over. The hype phase can accompany dramatic price moves as demand outstrips supply for an extended period and the market ignores bad news and doubles down on good news.
Stage 4: First cracks. At this stage, some cracks appear. Bad news hits that threatens the narrative. The story is crowded and early entrants think maybe the story is over so they take some profits. There is a meaningful pullback in price. This pullback shakes off the weaker and more recent buyers but those that believe in the narrative appear on the bid and the price stabilizes. Slowly, the importance of the bad news dissipates and price climbs back towards the highs.
Stage 5: The final hype wave. As price breaks through and makes new highs, the narrative often goes into overdrive. Longs are emboldened by the price action and a strong feeling of FOMO comes over anyone who is not participating. Depending on the story, you will often see the narrative cross over from financial media to the mainstream media at this point if the narrative is interesting and important enough.
Non-experts will join the party (retail and macro tourists) and this will push price aggressively higher. Stage 5 is usually the most surprising and volatile part of the narrative cycle as sellers step away and buyers get desperate. Magazine covers and fawning media profiles tend to appear at this stage.
Stage 6: The Peak and the Turn. The top in the narrative and price can be a long-drawn-out process or an impulsive overshoot and collapse. Often, it’s like the climax in a movie with a huge flashy rip higher followed by a rapid reversal that catches everyone on the wrong side.
Excellent traders will realize there has been a meaningful turn in the narrative here, even when price continues to make new highs. Bad traders hate to give up on winning trades and great stories and will fall victim to powerful confirmation bias. As long as price continues to rise, most traders will ignore information that goes against the narrative.
It’s important to realize that markets are not always correct. The wisdom of the crowd is powerful but not infallible.
Stage 7: The End. As a narrative expires, people lose interest and only those with bad discipline hang on. Shorts hammer the price down and longs slowly but surely get out. Market themes are like fashion trends. The market’s interest is fickle and limited. People get bored of a theme, and they move on. Sometimes this will be justified by fundamentals and sometimes it will simply be that a sexier, more interesting theme came along.
That is the narrative cycle.
Remember, I am not an investor and this is not about investing. It is about understanding the current stage of the narrative cycle so that as new information arrives, you can capitalize. If you know where you are in the story and understand current positioning, you will have an edge as the cycle moves from stage to stage. These narrative cycles can last hours, days, or weeks.
Understand the stories the market is telling itself and learn to identify when the market is falling in or out of love with a narrative.
Here’s the narrative arc for ARKK. It has gone through the seven stages of my narrative cycle. Cathie Wood has gone from fawning media profiles and God-like status to a handy punching bag for all the retail-driven Fed-gasoline-fueled excess of 2021.
The arc of ARKK: Textbook!
Crypto
I have been bearish crypto since November 2021 based on the narrative cycle and its relationship to the economic and halving cycles of bitcoin (see here, here, and here). The narrative cycle stayed bullish due to FOMO and price momentum in Q4 2021 even as it was becoming obvious that headwinds for crypto were increasing. Massively.
Now, I feel that we hit peak fear yesterday as the market sold risky assets indiscriminately on the Russian invasion, even though empirically most military actions have been buying opportunities in risky assets, not selling opportunities. The initial invasions of Vietnam, Iraq, and Crimea were all times to buy, not sell. The simple reason for this is that the human toll of war is terrifying but the economic impact on US and global growth tends to be minimal. As such, markets tend to overreact to scary military stuff.
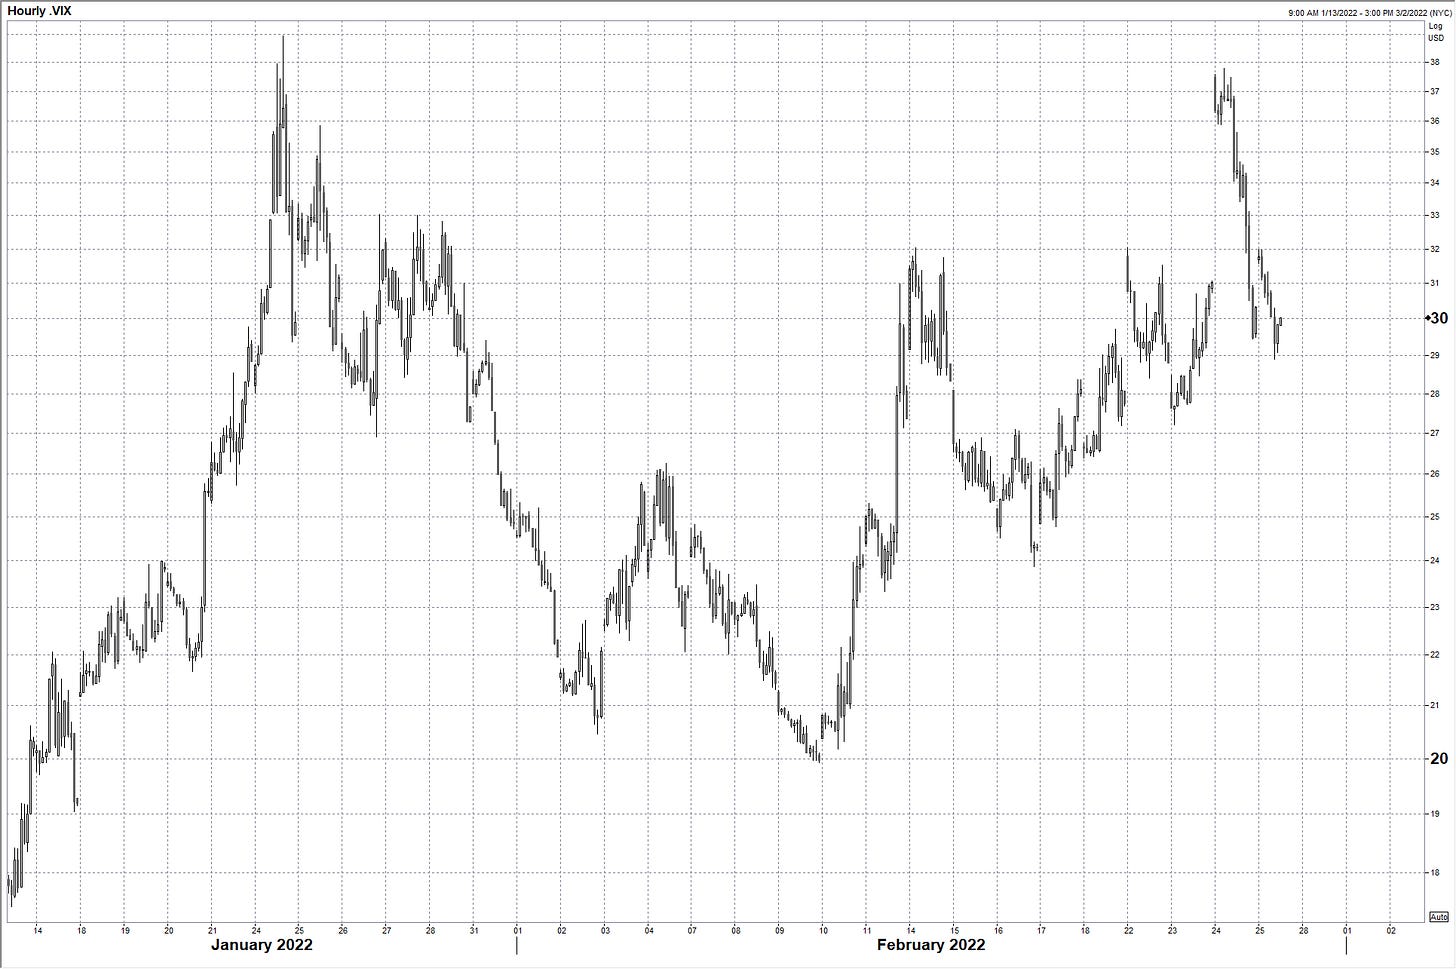
The VIX made a nice double top, gold made a massive fake breakout and reversal, and SPX and NASDAQ made bull hammer bottoms. See these three charts.
VIX gapped higher and formed a double top on Russia
Gold daily chart: False break and massive reversal
S&P Futures slingshot reversal and bull hammer through key 4225 level
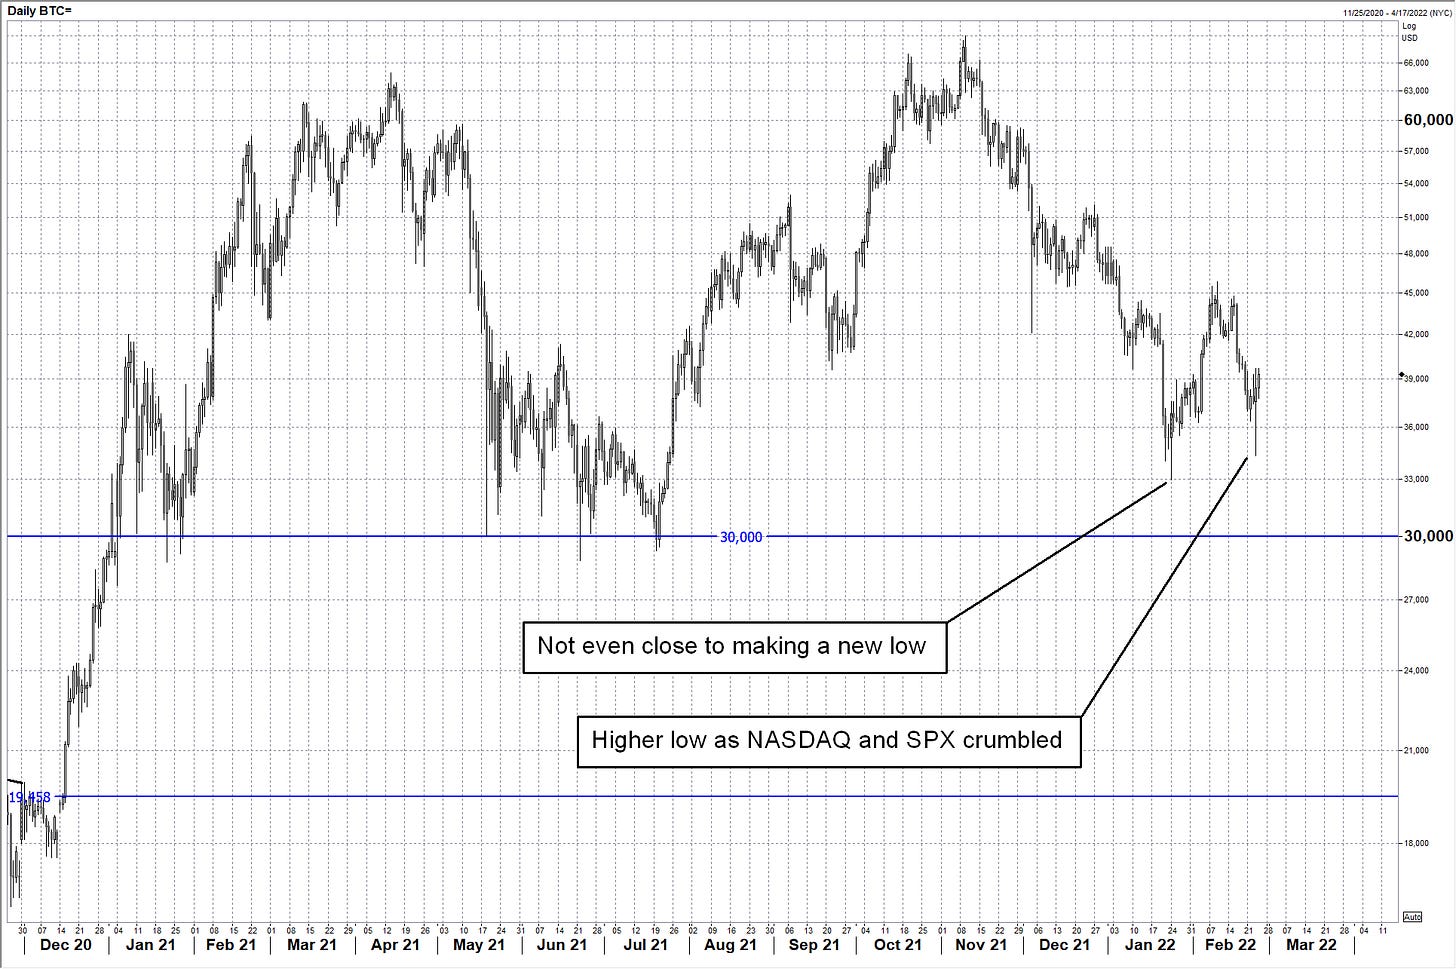
Even more interesting is that as SPX and NASDAQ broke aggressively through the lows, bitcoin (also a levered risky asset) didn’t even come close to making a new low. That is a bullish divergence. When something makes higher lows while all its peers (or its indicators like RSI) are making deep new lows… That’s bullish.
Trade 4: Long bitcoin at 39200
I sent something out on this yesterday at 3:08PM (sent to am/FX and MacroTactical Crypto subscribers) and went long BTC at 38220, but for this blog, I will always mark to market at the level the asset trades when I hit send on the email. Again, the point of this particular writing is not to post strings of winning trades; it’s an educational Substack. So here I’m long at worse levels than IRL. It doesn’t matter.
My stop loss is 31400, which would be a new low -$1600. I always like to give it a bit of room through the support in case there is a choppy move. There is giant support at 28500/30000 so you could put your stop below 28500, in theory, but I think that if 31400 breaks, my thesis is wrong and I should get out. I will also get out if SPX goes below 4100.
Bitcoin: Impressive resilience
In the interest of brevity, let me outline my view here in bullet point form as most of the idea has already been laid out above. I am bullish bitcoin because:
The narrative cycle in risky assets and crypto has rolled over massively and crypto market cap is down almost 50% from the highs. Web3 skeptics abound these days, the GameFi hype machine has quieted down, and all the while, bitcoin never made a new low, even when NASDAQ soiled the bedsheets (bullish divergence).
Climactic low in risky assets on Russian invasion of Ukraine. History shows military invasions often lead to high-velocity selloff and then bottoms for risky assets.
The market has made its peace with 6 or 7 Fed hikes.
Hammer bottoms in SPX and NASDAQ.
Double top in VIX.
Gold mega reversal and oil unchanged from pre-invasion levels.
US economic data stabilizing after omicron scare in January.
NOTE: QT is on the horizon, and that is a bearish risk for crypto and risky assets, but I think we could get a tradable rally here for the next 4 weeks or so.
This is a 2-week to 1-month time horizon trade. Target is anywhere close to 50,000. This is a TYPE II trade, so let’s allocate $2,000 out of $100,000 free capital. Note that I’m using $100,000 as the free capital number for every trade as I am not revalling the entire portfolio in real-time… It’s too much work for not enough educational upside… and that’s not the point of 50in50. Risking $2,000 and the stop loss is $7,800 away so that means 0.25 BTC is the position size.
The completed worksheet for this trade is here.
You can grab your own blank worksheets too. Grab a PDF of it here. Or the Microsoft Excel version here.
That’s it for today. As always, I will monitor the performance and offer detailed updates as we progress. See you next week!
Thanks for reading.
Trade at your own risk. Be smart. Have fun. Call your mom.
My global macro daily is here
My crypto substack is here
And this is my Twitter
DISCLAIMER: Nothing in “50 Trades in 50 Weeks” is investment advice. Do your own research and consult your personal financial advisor. I’m putting out free thoughts for people that want to learn. This is an educational Substack. Trade your own view!


Week 4: A respite from winter